The Charleston housing market continues to expand in both supply and activity, but July's numbers reinforce that the market is becoming increasingly dependent on location, property type, and price point.
Across the Charleston Trident Multiple Listing Service, new listings, pending sales, inventory, and prices all finished July above their levels from one year ago. Closed sales were slightly lower for the month, but year to date transaction activity remained ahead of 2025. At the same time, homes are taking somewhat longer to secure a buyer.
Taken together, the data points to a market that is neither accelerating uniformly nor retreating. Instead, Charleston is becoming more differentiated, with meaningful strength continuing in some segments even as buyers gain more choices.
More Homes Are Coming to Market
The Charleston Trident market ended July with 5,697 homes for sale, an increase of 4.7% from 5,443 one year earlier. New listings also increased 4.5% year over year to 2,395.
The longer monthly history shows that inventory has been building throughout much of 2026, although that growth slowed heading into July. Inventory reached 5,771 homes in May and 5,721 in June before easing slightly to 5,697 in July. Compared with June, July inventory declined approximately 0.4%.
That is an important distinction. Buyers have more choices than they did a year ago, but July did not bring another significant surge in available homes. Supply remained elevated while beginning to level off month to month.
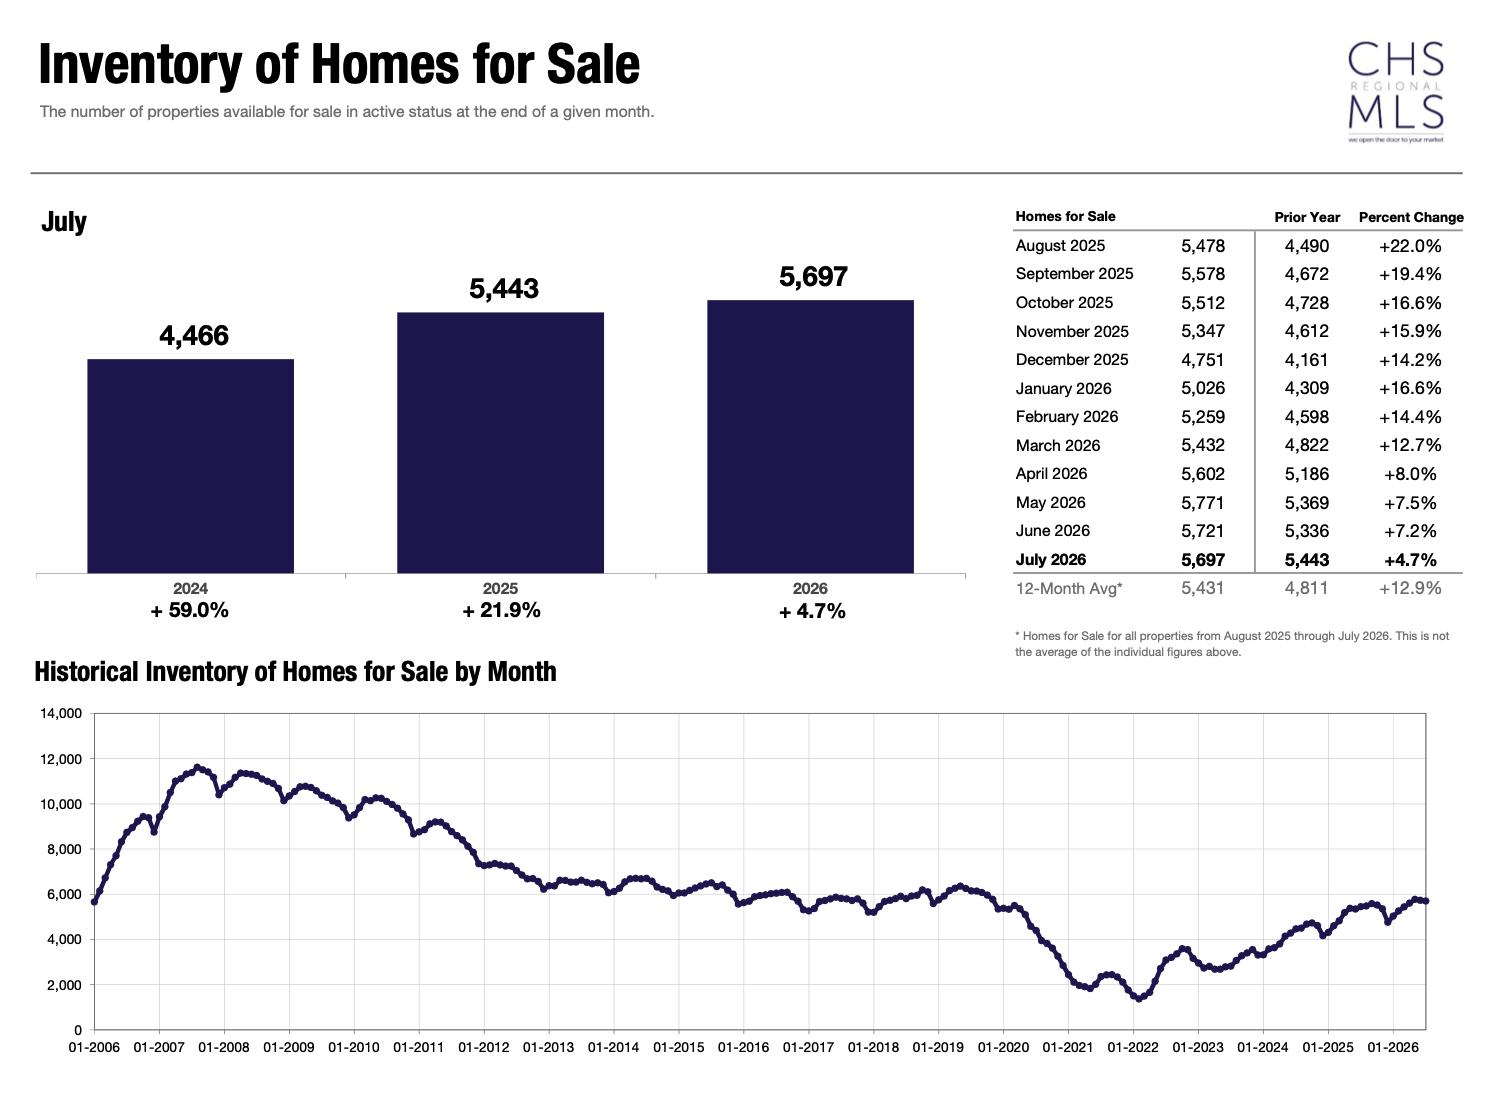
Inventory of Homes for Sale - July 2026, CHSMLS
Demand is Still Showing Through
July closed sales declined modestly, from 1,729 in July 2025 to 1,698 in July 2026, a decrease of 1.8%. The broader picture is stronger, however. Through July, 11,216 properties had closed, up 4.8% from the same period in 2025.
Pending activity provides another indication of continued demand. 1,689 properties went under contract in July, 6.4% more than one year earlier, while year to date pending sales increased 9.0%.
On a rolling 12 month basis, pending sales across the region increased 7.1%. That growth was strongest above $1 million, where pending activity increased 12.4%.
The combination suggests that July's lower closing count should not be interpreted in isolation. Buyers remain active, even as transactions may take longer to progress from listing to contract and ultimately to closing.
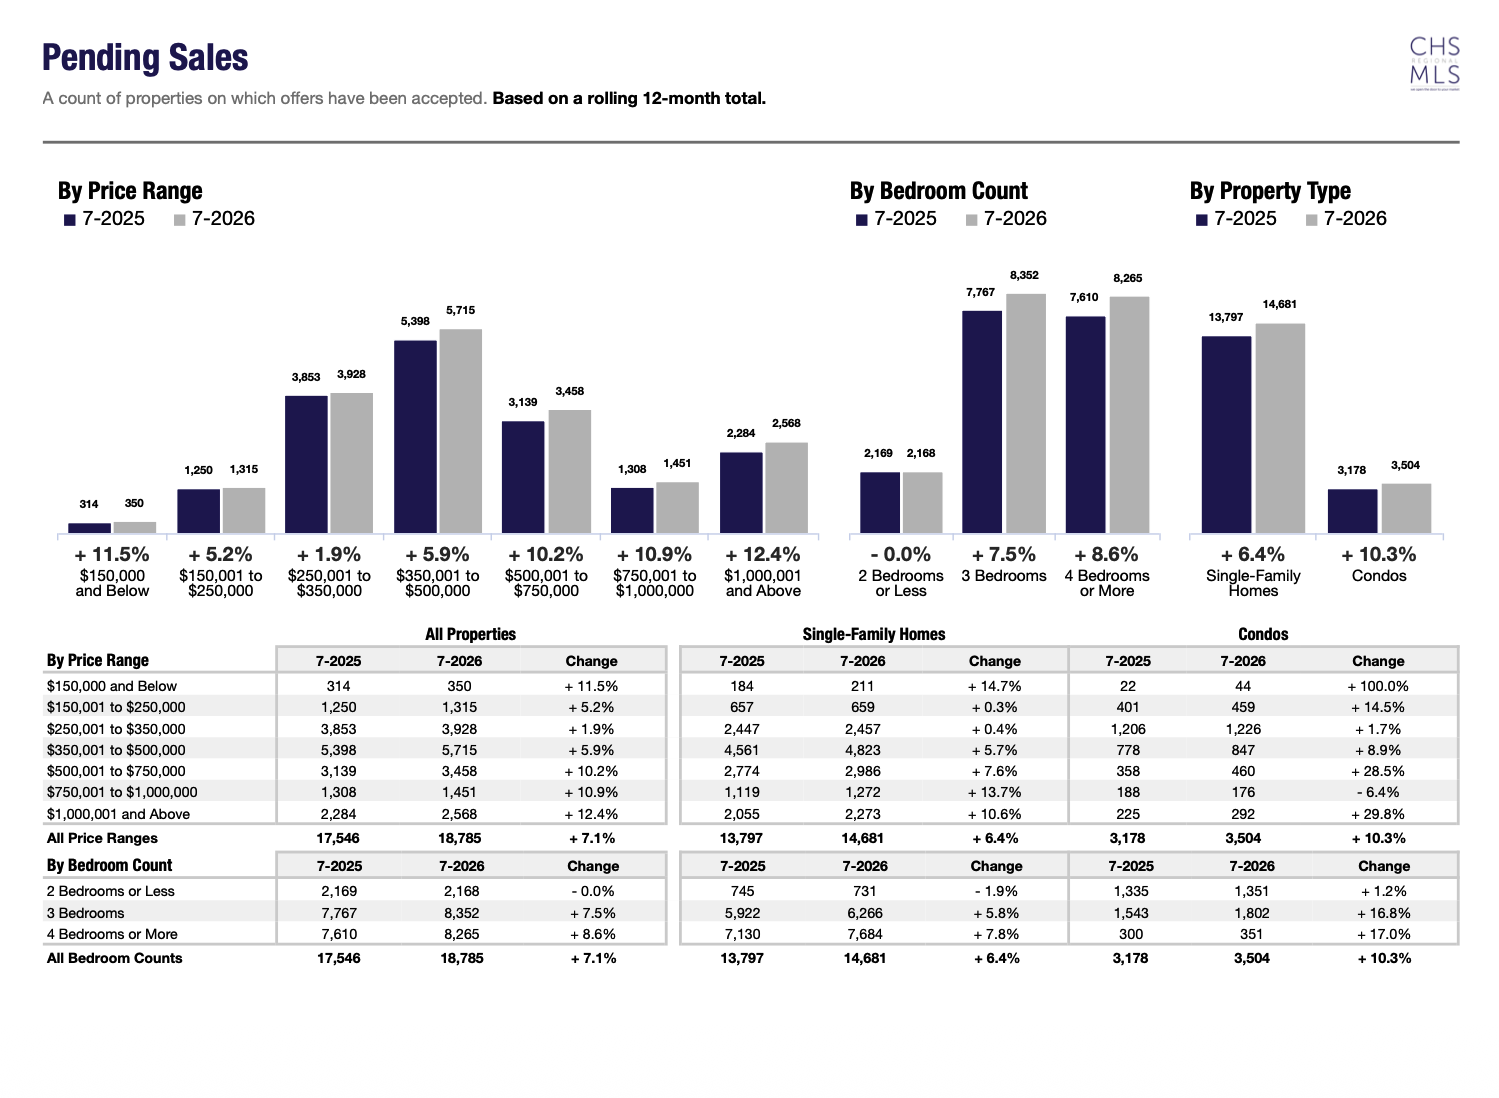
Pending Sales - July 2026, CHSMLS
Prices Are Holding Despite Greater Choice
The July median sales price reached $449,918, up 4.6% from $429,950 in July 2025. The year to date median increased 2.1% to $437,525. Average sales price also rose year over year, increasing 9.1% to $676,049.
The rolling 12 month median was $432,000, up 2.1%, while the single family median increased 2.2% to $460,000.
Month to month, however, the average sales price declined from $731,814 in June to $676,049 in July, a decrease of approximately 7.6%. This is a good example of why monthly pricing movements should be interpreted carefully. Changes in which properties close during a particular month, especially in a market with significant luxury and coastal inventory, can materially affect the average.
The longer trend remains more stable than that single monthly movement would suggest.
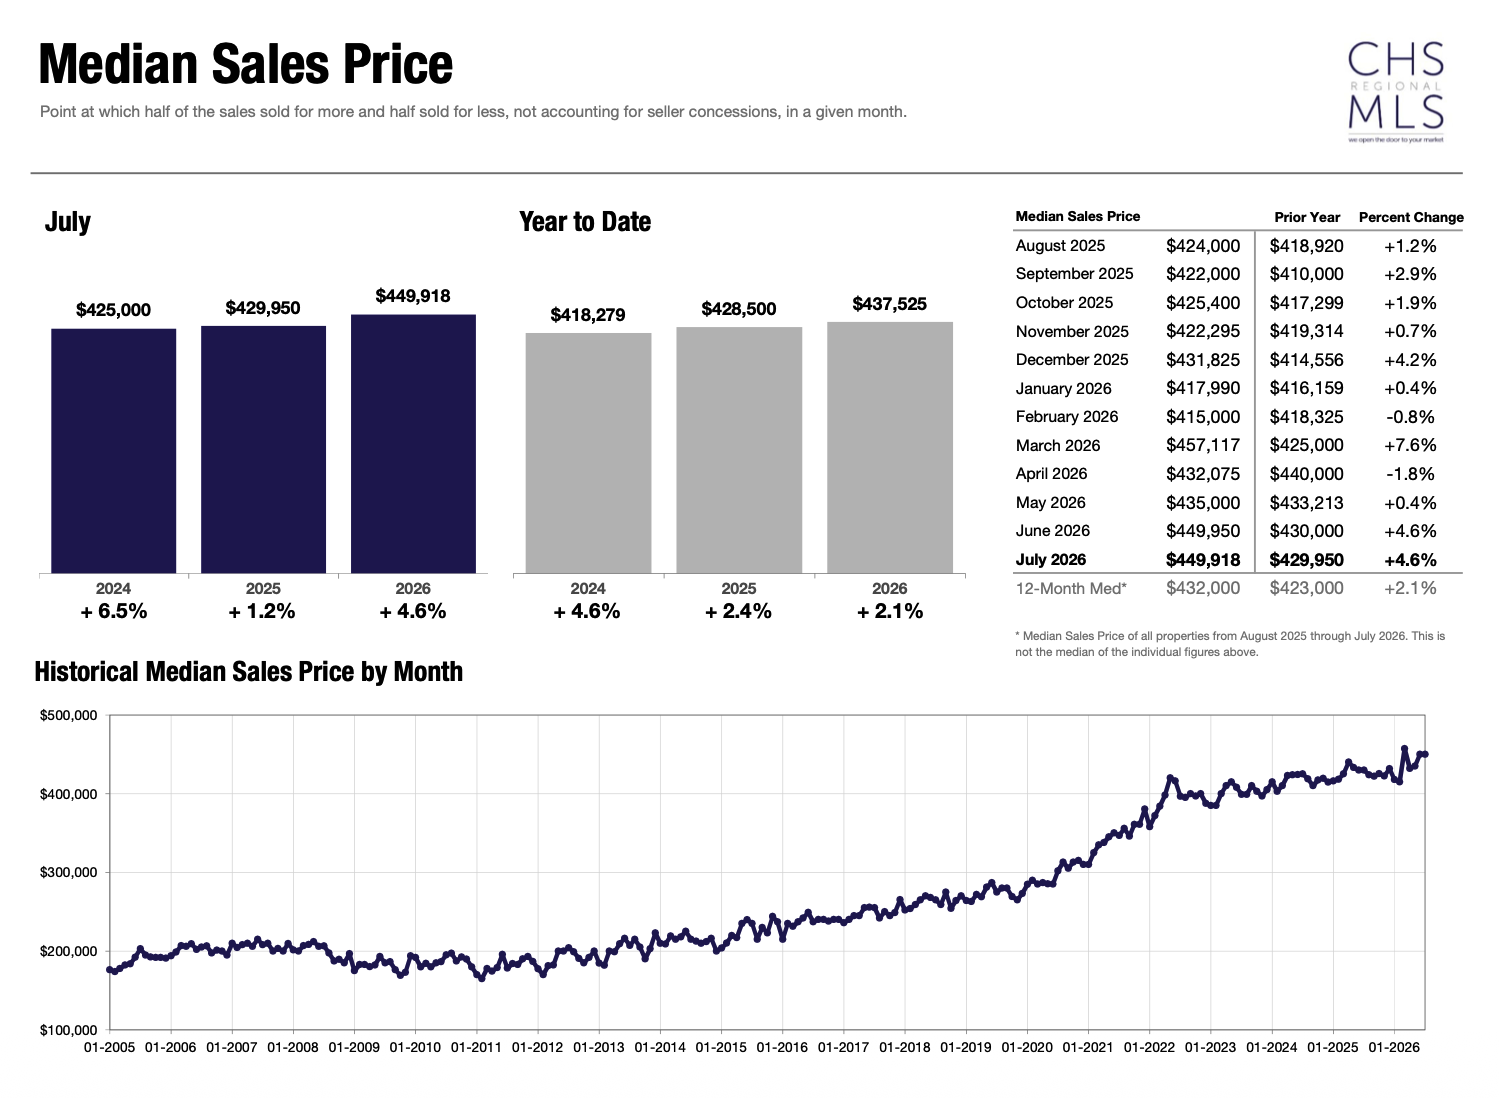
Median Sales Price - July 2026, CHSMLS
Buyers Have Slightly More Time
Homes averaged 47 days on market in July, compared with 45 days one year earlier. Year to date, the average increased from 48 to 52 days.
The month to month movement actually went in the opposite direction. Average days on market declined from 48 days in June to 47 in July, a decrease of approximately 2.1%.
The broader housing supply data shows considerable variation by price. Properties between $500,001 and $750,000 were the quickest selling segment on a rolling basis at 47 days, while properties priced at $150,000 and below averaged 69 days.
For sellers, the shift reinforces the importance of positioning a property correctly from the beginning. Buyers have more options than they did a year ago, but that additional choice has not translated into a broad retreat in pricing or demand.
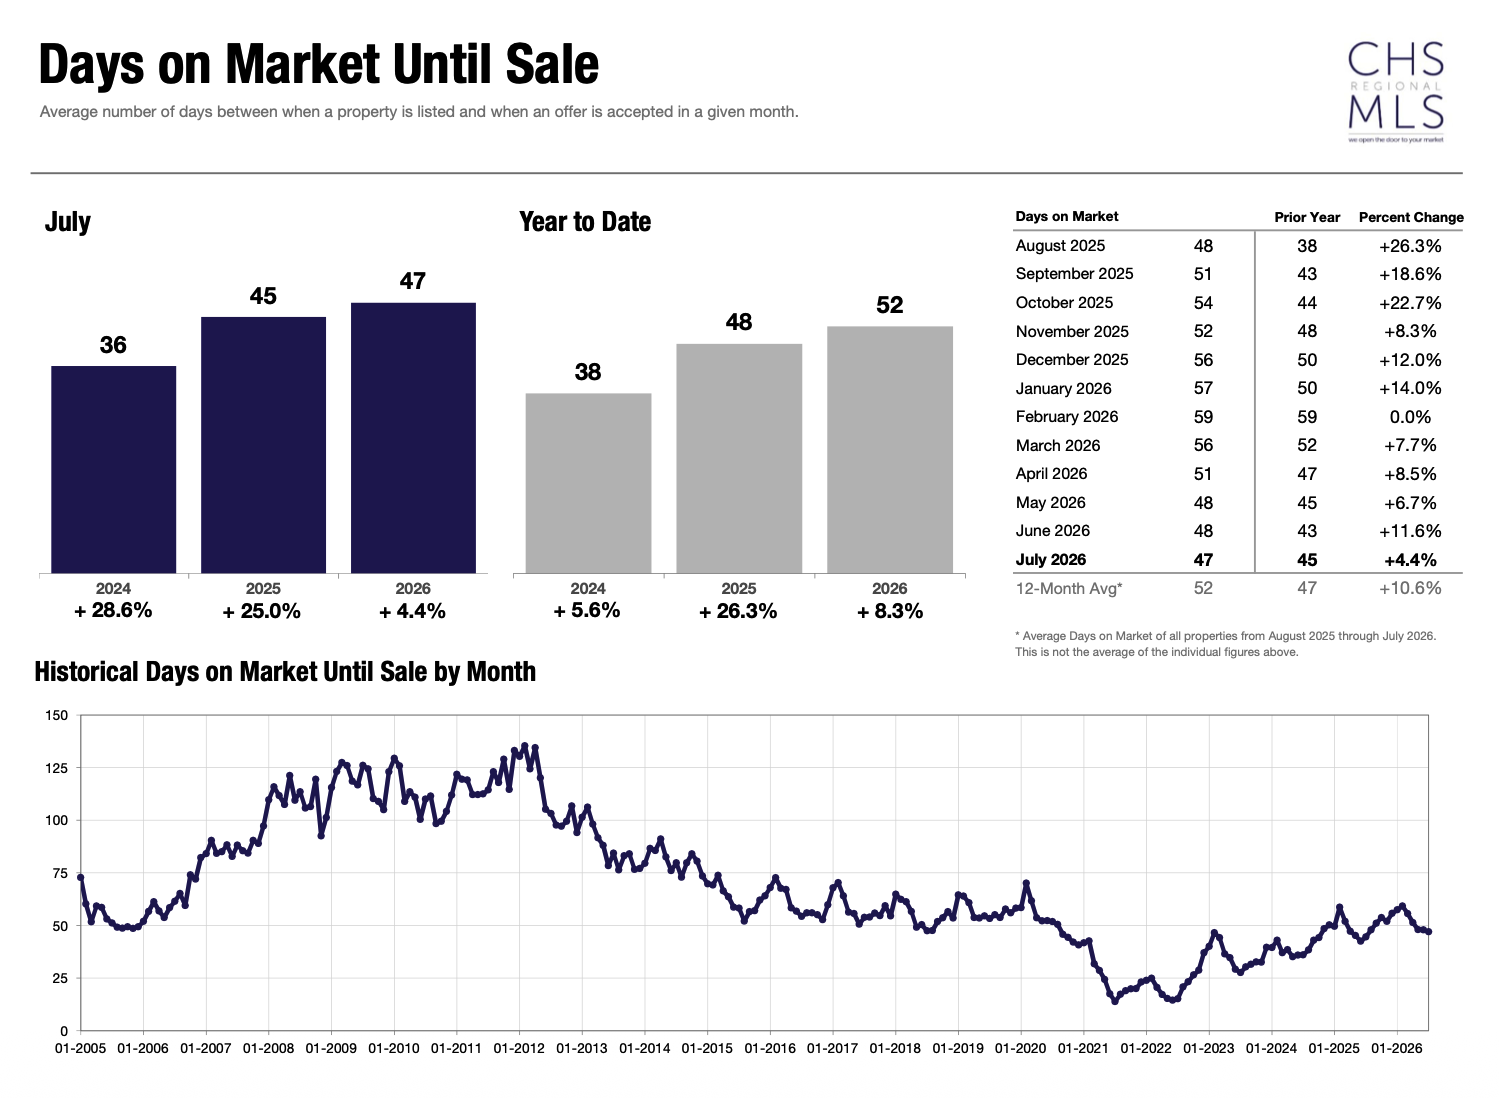
Days on Market Unit Sale - July 2026, CHSMLS
The Upper End Remains Active
One of the clearest themes across Charleston's broader market is continued activity at higher price points.
Pending sales above $1 million increased 12.4% on a rolling 12 month basis, making it the strongest price category for pending activity.
Local market results reinforce that the luxury segment is not moving uniformly, but meaningful activity remains present. Downtown Charleston, Daniel Island, Isle of Palms, Kiawah, and portions of Mount Pleasant all recorded seven figure average sales prices in July, while individual monthly results varied significantly based on property type and transaction mix.
The takeaway is less about any one luxury price statistic and more about the continued depth of demand at the upper end.
Charleston's Submarkets Are Telling Different Stories
The regional numbers become more revealing when viewed alongside individual markets.
In Downtown Charleston, combined detached and attached closings increased from 27 to 32 year over year, while combined inventory declined from 152 to 136 properties. The mix of sales also shifted substantially between the two property types.
On Daniel Island, detached and attached inventory combined increased from 61 properties to 90, while total July closings increased from 23 to 29. Attached sales were particularly active, increasing from six closings to 13.
Johns Island recorded 75 combined closings in July, compared with 73 one year earlier, while combined inventory increased from 207 to 226. Single family average sales price increased more than 22% year over year, although the mix of sales should be considered when interpreting that monthly figure.
In the Greater Summerville Area, combined inventory increased to 745 properties from 675 one year earlier while combined July closings declined to 239 from 255.
These differences are precisely why Charleston cannot be reduced to a single market statistic. Conditions on the peninsula can differ significantly from Mount Pleasant, Daniel Island, Summerville, Johns Island, or the barrier islands.
DOWNTOWN CHARLESTON
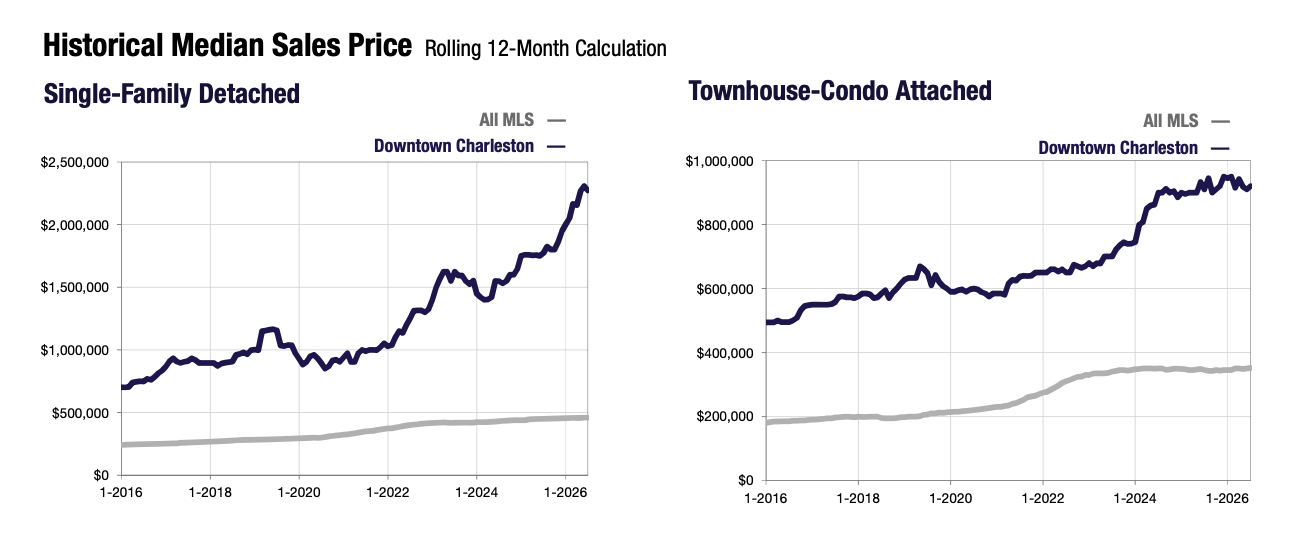
DOWNTOWN CHARLESTON HISTORIC MEDIAN SALES PRICE - 10 YEAR LOOKBACK, CHSMLS
DANIEL ISLAND
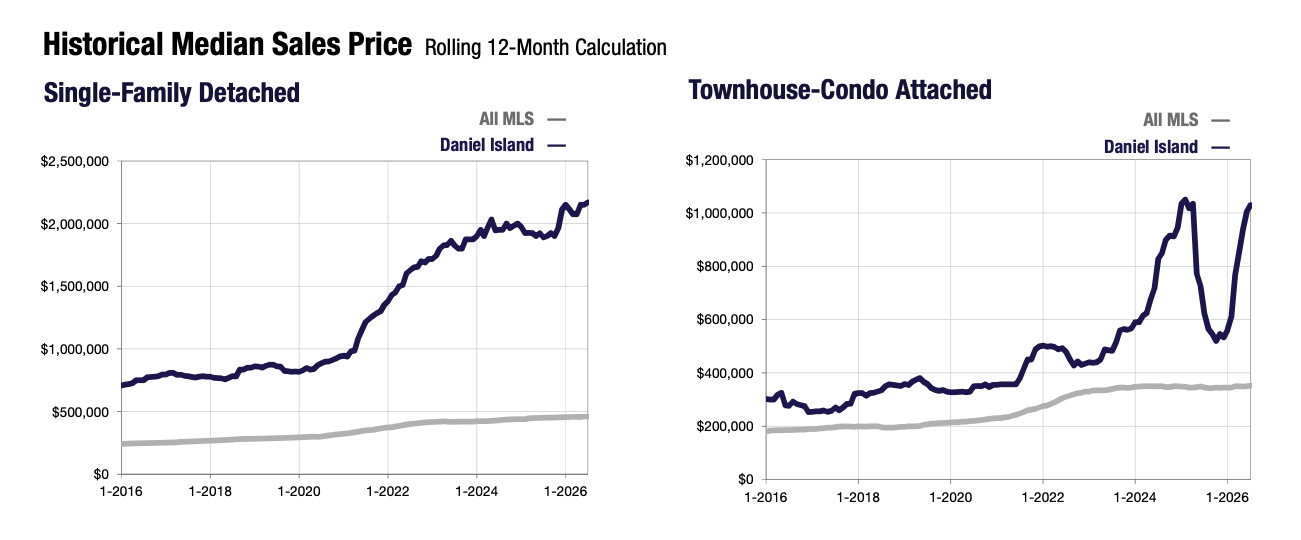
DANIEL ISLAND HISTORIC MEDIAN SALES PRICE - 10 YEAR LOOKBACK, CHSMLS
JOHNS ISLAND
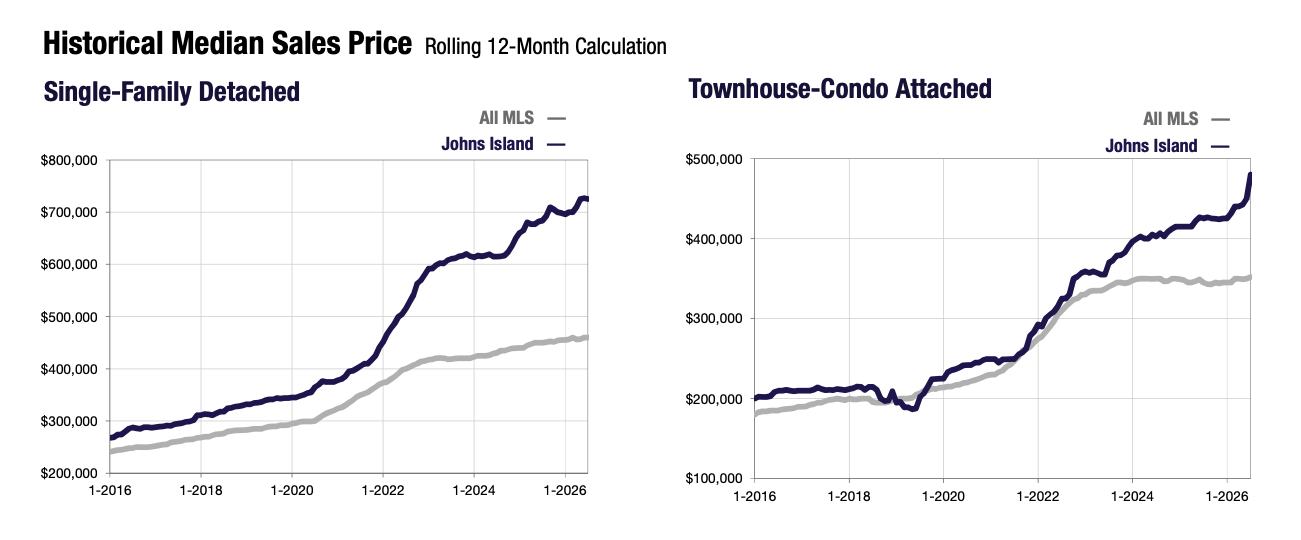
JOHNS ISLAND HISTORIC MEDIAN SALES PRICE - 10 YEAR LOOKBACK, CHSMLS
SUMMERVILLE
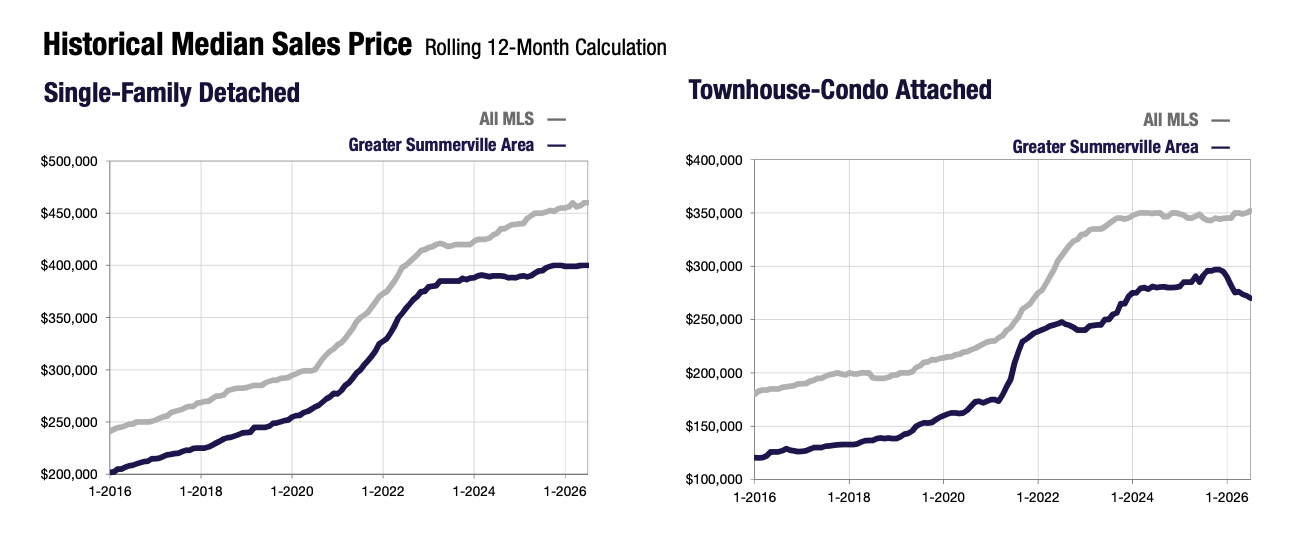
GREATER SUMMERVILLE HISTORIC MEDIAN SALES PRICE - 10 YEAR LOOKBACK, CHSMLS
What This Means for Buyers and Sellers
For buyers, July offered more choices than the market did one year ago, while pending sales suggest that demand for desirable properties remains meaningful. Additional inventory can provide more opportunity to compare homes and negotiate from a more informed position, but conditions vary significantly by neighborhood, property type, and price point.
For sellers, the market continues to reward precision. Higher inventory means more direct competition, and slightly longer marketing times make pricing and presentation increasingly important. At the same time, rising median prices and continued pending activity indicate that buyers have not broadly withdrawn from the market.
Charleston remains a market where local context matters more than ever.
Looking Ahead
The second half of 2026 will help clarify whether Charleston's inventory begins to stabilize after the growth seen over the past year and whether strong pending activity translates into continued closed sales.
Pricing will also be worth watching. The broader trend remains positive, but monthly average prices can move sharply as the composition of sales changes, particularly within the region's luxury and coastal communities.
For now, July reflects a market with more choice, continued demand, and increasingly distinct conditions from one submarket to the next.
Data Sources & Methodology
This Market Perspective incorporates July 2026 data from the Charleston Trident Multiple Listing Service, including Monthly Indicators, the Housing Supply Overview, and Charleston Trident Association of REALTORS® Local Market Updates. Reports are current as of August 7, 2026 and were produced by ShowingTime Plus, LLC.
Monthly figures represent July 2026 unless otherwise noted. Year over year comparisons compare July 2026 with July 2025. Year to date figures cover January through July. Rolling 12 month statistics generally cover August 2025 through July 2026 compared with the preceding comparable period.
For combined local market figures below, detached and attached inventory are added together. Combined average sales price and days on market are calculated using closed sales as the weighting factor rather than simply averaging the two reported values.
Check out this article next