The Charleston housing market continues to demonstrate resilience, but August's numbers reveal a market becoming increasingly differentiated by location, property type, and price point.
While inventory remains above last year's levels, the pace of that growth has moderated. Pending sales continue to improve over the longer term, particularly in the upper price ranges, while buyers are taking more time to evaluate their options. Across Charleston's individual communities, the differences are even more pronounced, with some markets experiencing increased sales activity and stronger pricing while others are seeing longer marketing periods and more selective demand.
The broader picture is one of continued activity rather than widespread acceleration or decline. Understanding the Charleston market increasingly requires looking beyond regional averages to recognize where demand is concentrating and how conditions are evolving within individual communities.
More Inventory, but Supply Growth Is Moderating
Charleston's housing inventory reached 5,593 homes in August, an increase of 2.1% compared to the same period last year.
While additional inventory continues to provide buyers with greater choice, the composition of that inventory is important. Single-family home inventory remained virtually unchanged year over year, increasing just 0.1%, while condominium inventory rose 7.1%.
The market's overall months supply of inventory declined slightly from 3.7 to 3.6 months, suggesting that available supply remains relatively balanced against the current pace of demand.
Inventory trends also varied considerably across price ranges. Homes priced between $500,001 and $750,000 experienced an 8.5% increase in available inventory, while properties priced above $1 million saw inventory rise 4.6%. Meanwhile, inventory between $750,001 and $1 million declined 9.0%.
These differences reinforce that increased supply does not necessarily translate into greater availability across every segment of the market.
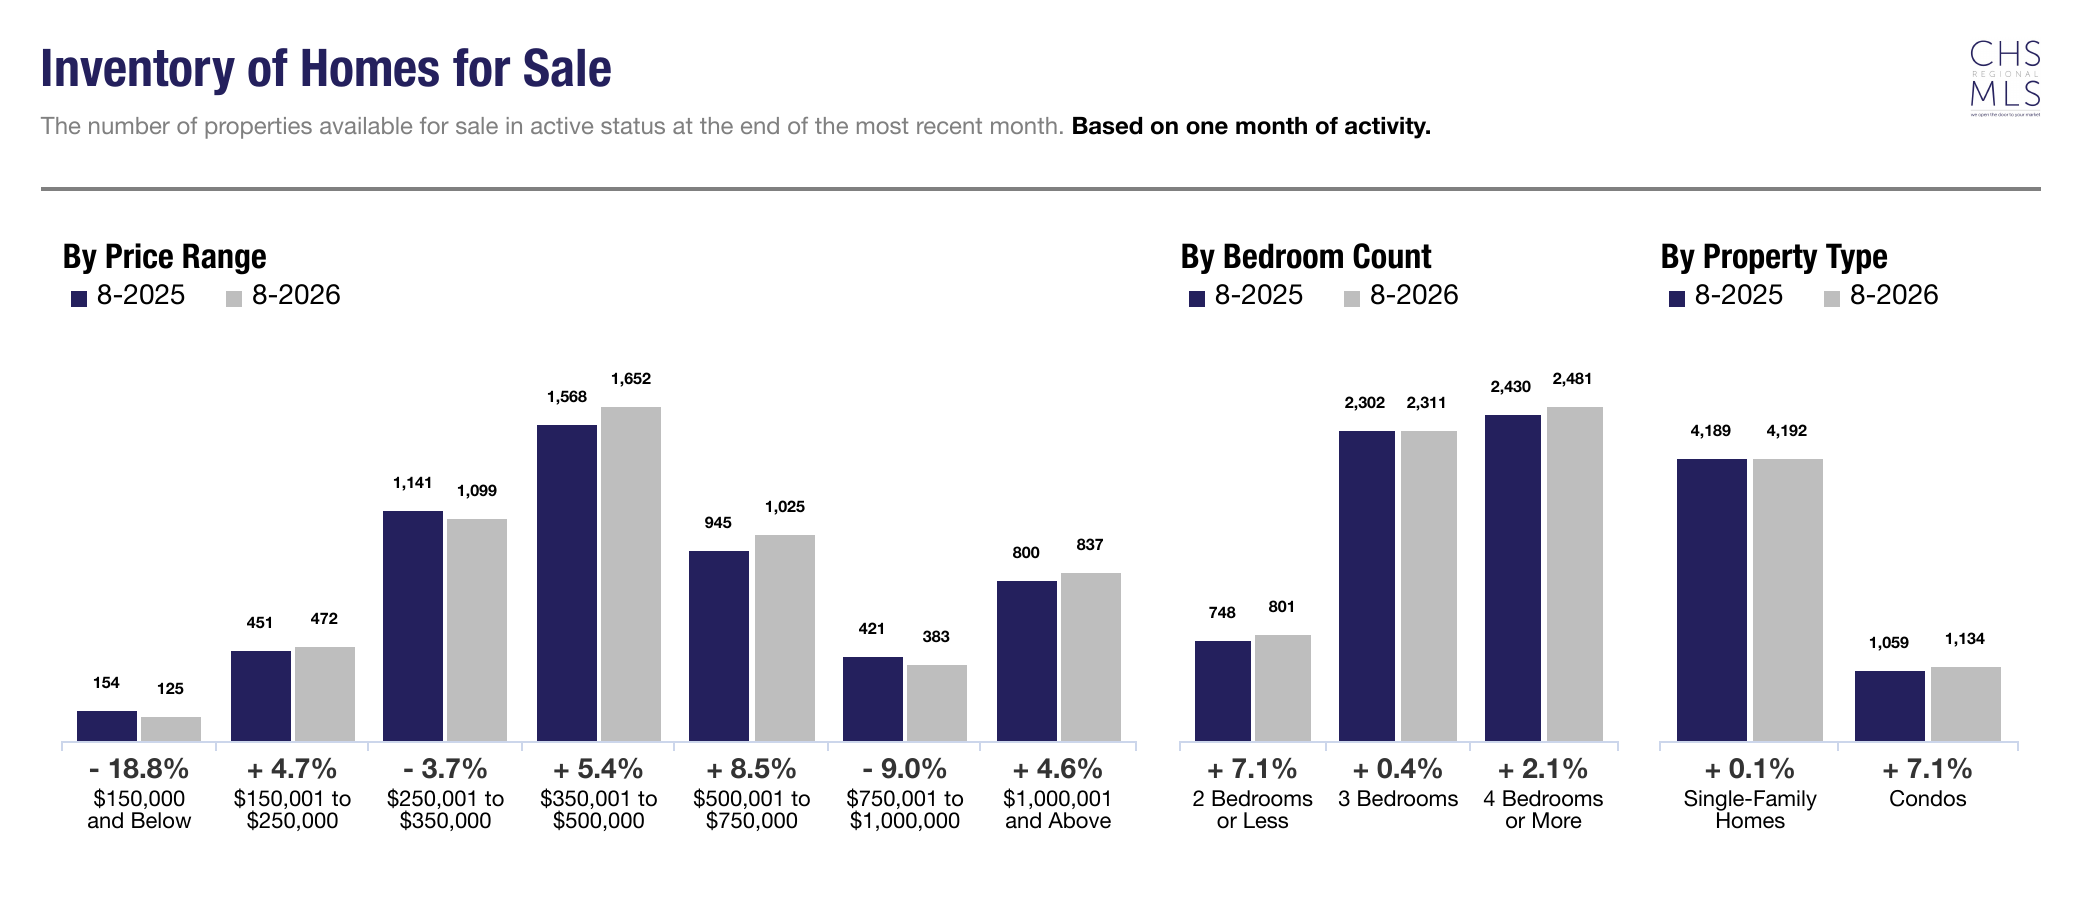
Inventory of Homes for Sale - August 2026, CHSMLS
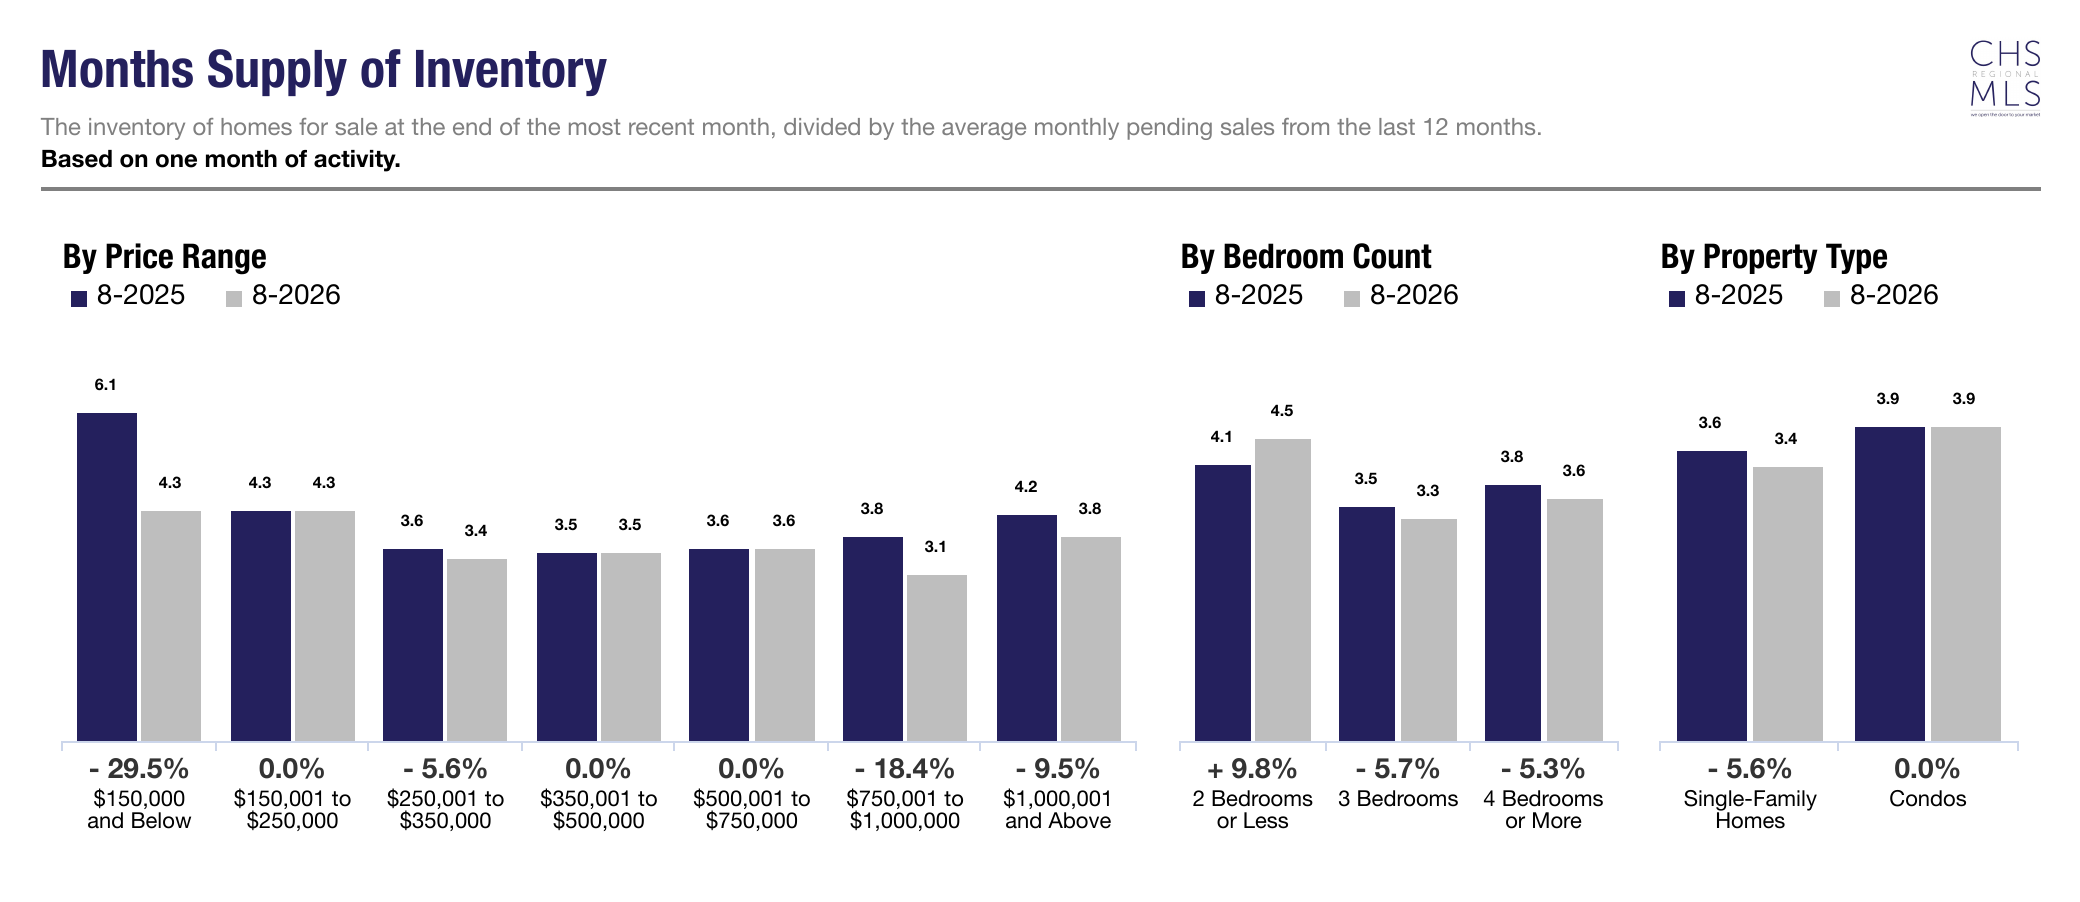
Monthly Supply of Inventory - August 2026, CHSMLS
Buyer Demand Remains Resilient
Despite a more selective environment, Charleston continues to demonstrate meaningful underlying demand.
For the 12-month period ending in August, pending sales increased 6.7% year over year, while closed sales rose 4.4%.
Activity was particularly notable in higher price ranges. Pending sales above $1 million increased 14.5%, representing the strongest percentage growth among the report's price categories. Closed sales in that same segment increased 10.6%.
The $750,001 to $1 million segment also demonstrated strength, with pending sales increasing 11.6% and closed sales rising 8.3%.
These figures suggest that demand remains active even as buyers become more deliberate in their purchasing decisions.
Importantly, the continued growth in pending transactions indicates that buyer interest has not disappeared. Instead, the market is becoming more dependent on individual property characteristics, pricing strategy, and the availability of compelling opportunities.
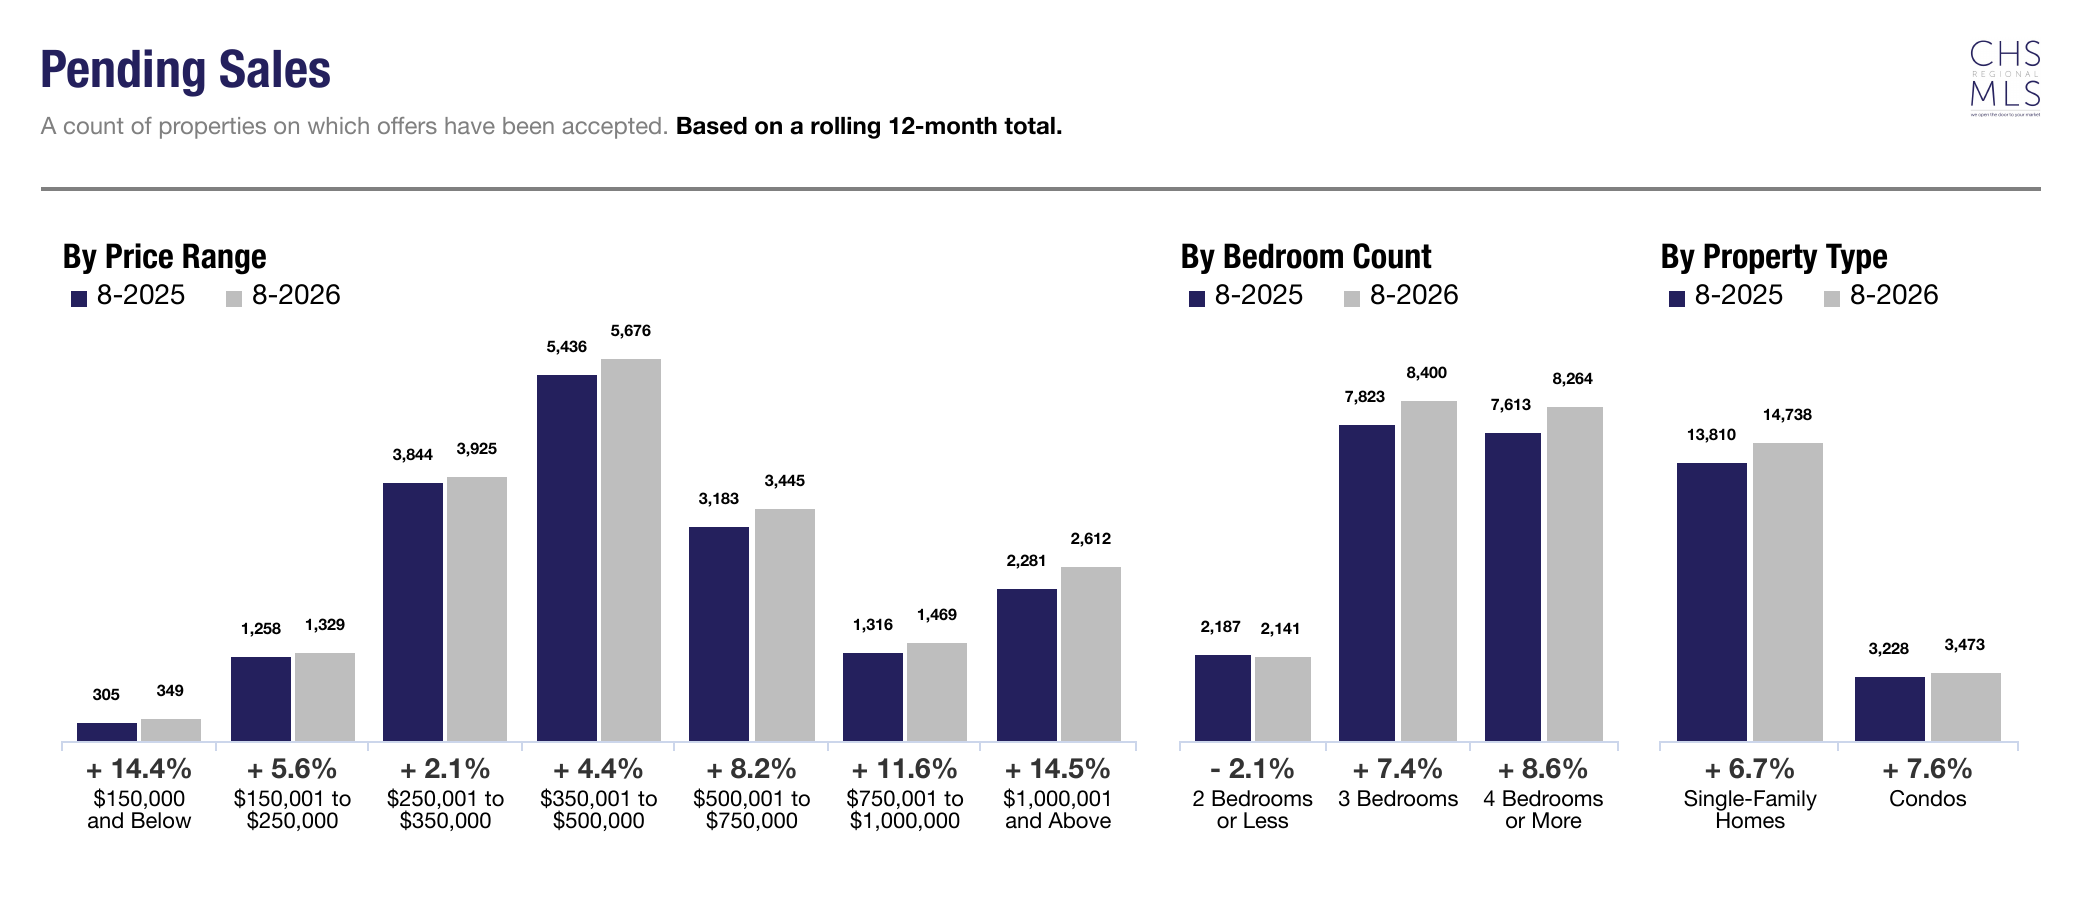
Pending Sales - August 2026, CHSMLS
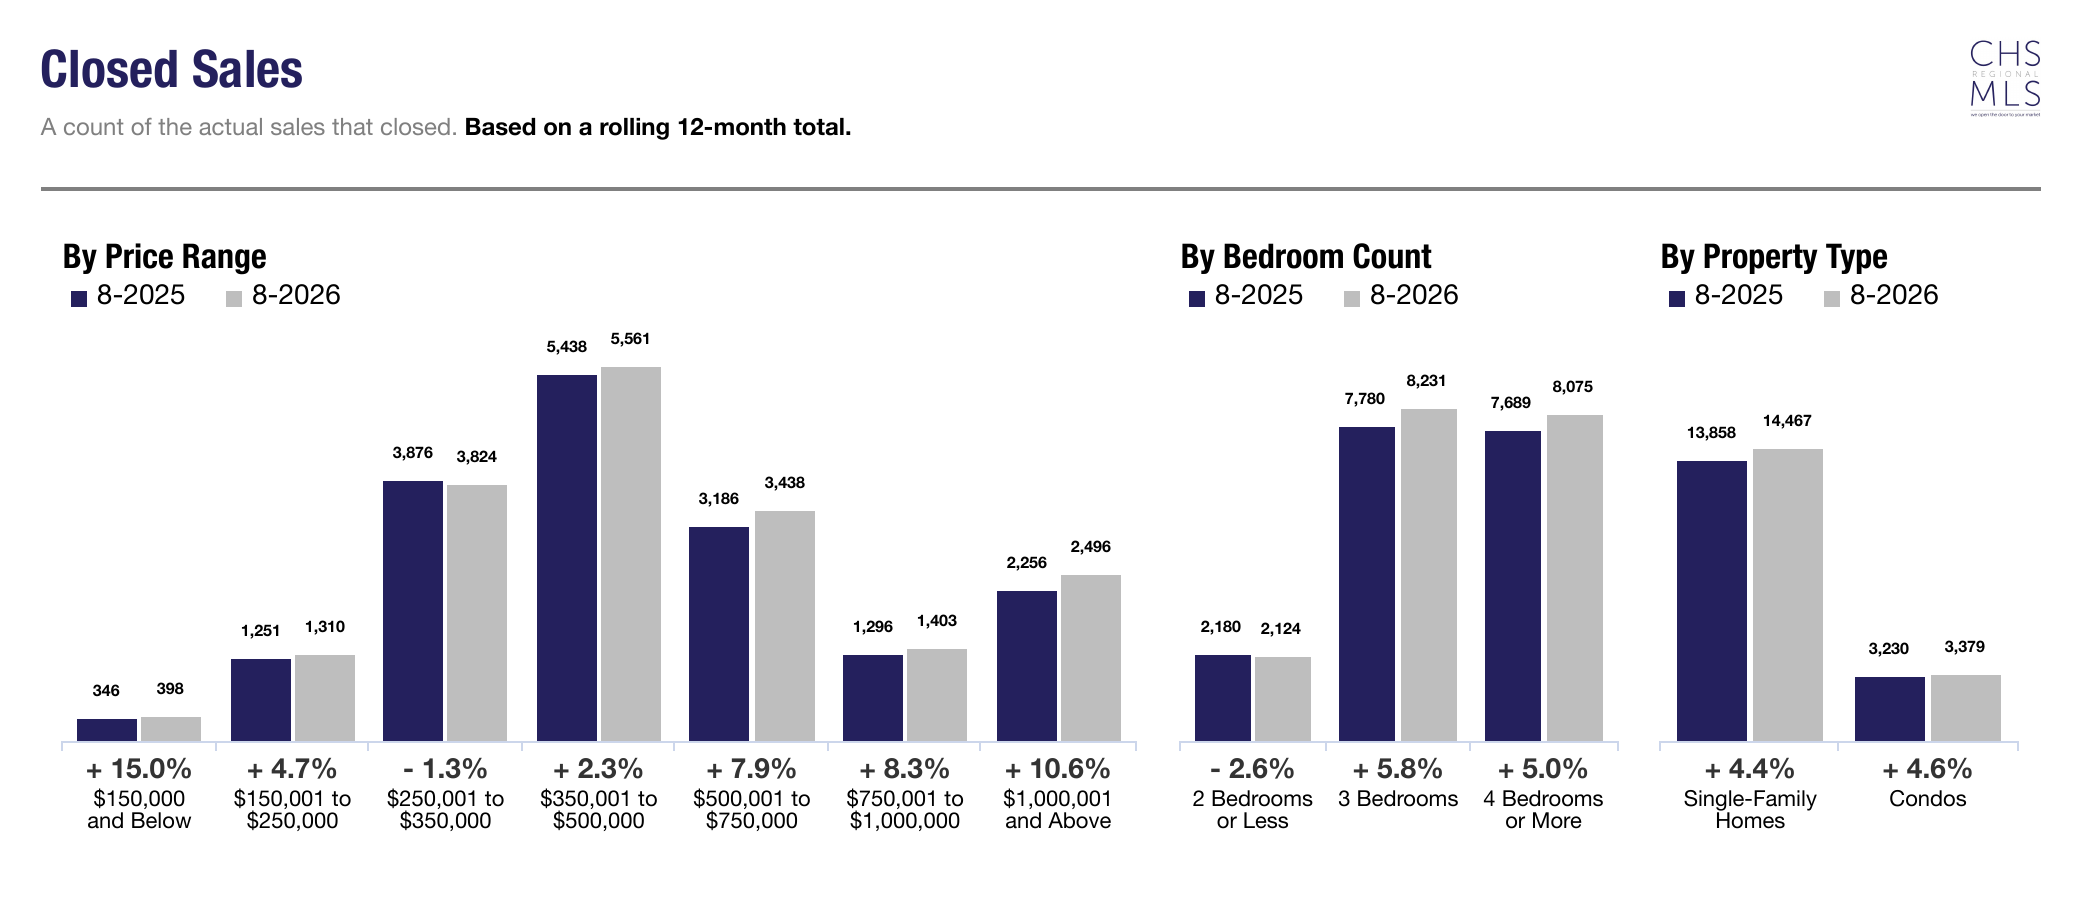
Closed Sales - July 2026, CHSMLS
Prices Continue to Show Stability
Charleston's rolling 12-month median sales price reached $433,335 in August, representing a 2.2% increase from the previous year.
Single-family home prices increased 2.1% to $460,623, while condominium prices rose 2.6% to $352,000.
Although these changes reflect continued price appreciation, the pace remains relatively measured.
The distinction between median prices and individual transaction values is especially important in Charleston, where luxury coastal properties and higher-value communities can meaningfully influence market averages.
Monthly fluctuations in average sales prices may reflect changes in the composition of closed transactions rather than a fundamental shift in property values.
For buyers and sellers, this reinforces the importance of evaluating comparable properties within a specific market rather than relying exclusively on regional pricing trends.
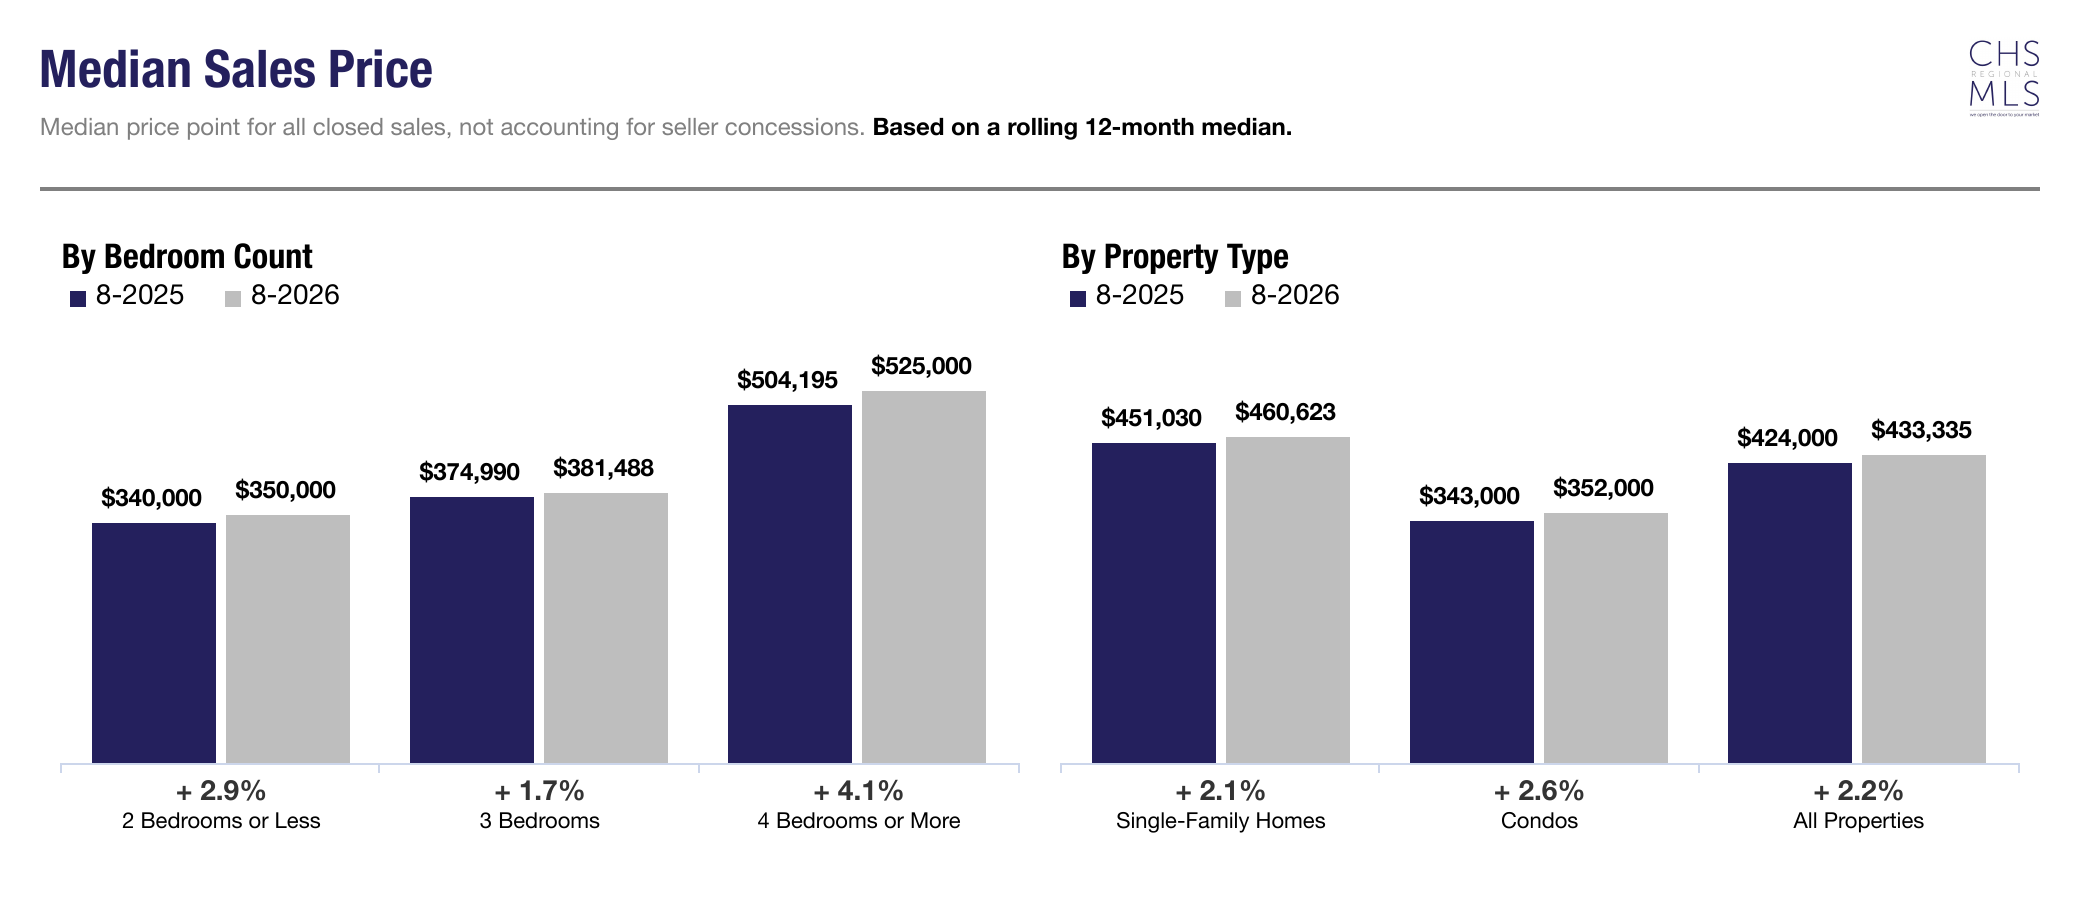
Median Sales Price - August 2026, CHSMLS
Buyers Are Taking More Time
One of the clearest changes in Charleston's housing market is the amount of time properties are spending on the market.
The rolling 12-month average reached 52 days on market, compared to 48 days during the preceding 12-month period.
Single-family homes averaged 51 days, an increase of 10.9%, while condominiums averaged 55 days, up 3.8%.
The shift was particularly noticeable among properties priced between $500,001 and $750,000, where average marketing time increased from 41 to 47 days.
However, longer marketing periods do not necessarily indicate declining demand. Instead, they suggest buyers have greater opportunity to compare available properties and make more deliberate decisions.
For sellers, this environment places additional emphasis on accurate pricing, thoughtful presentation, and strategic positioning from the beginning of the listing process.
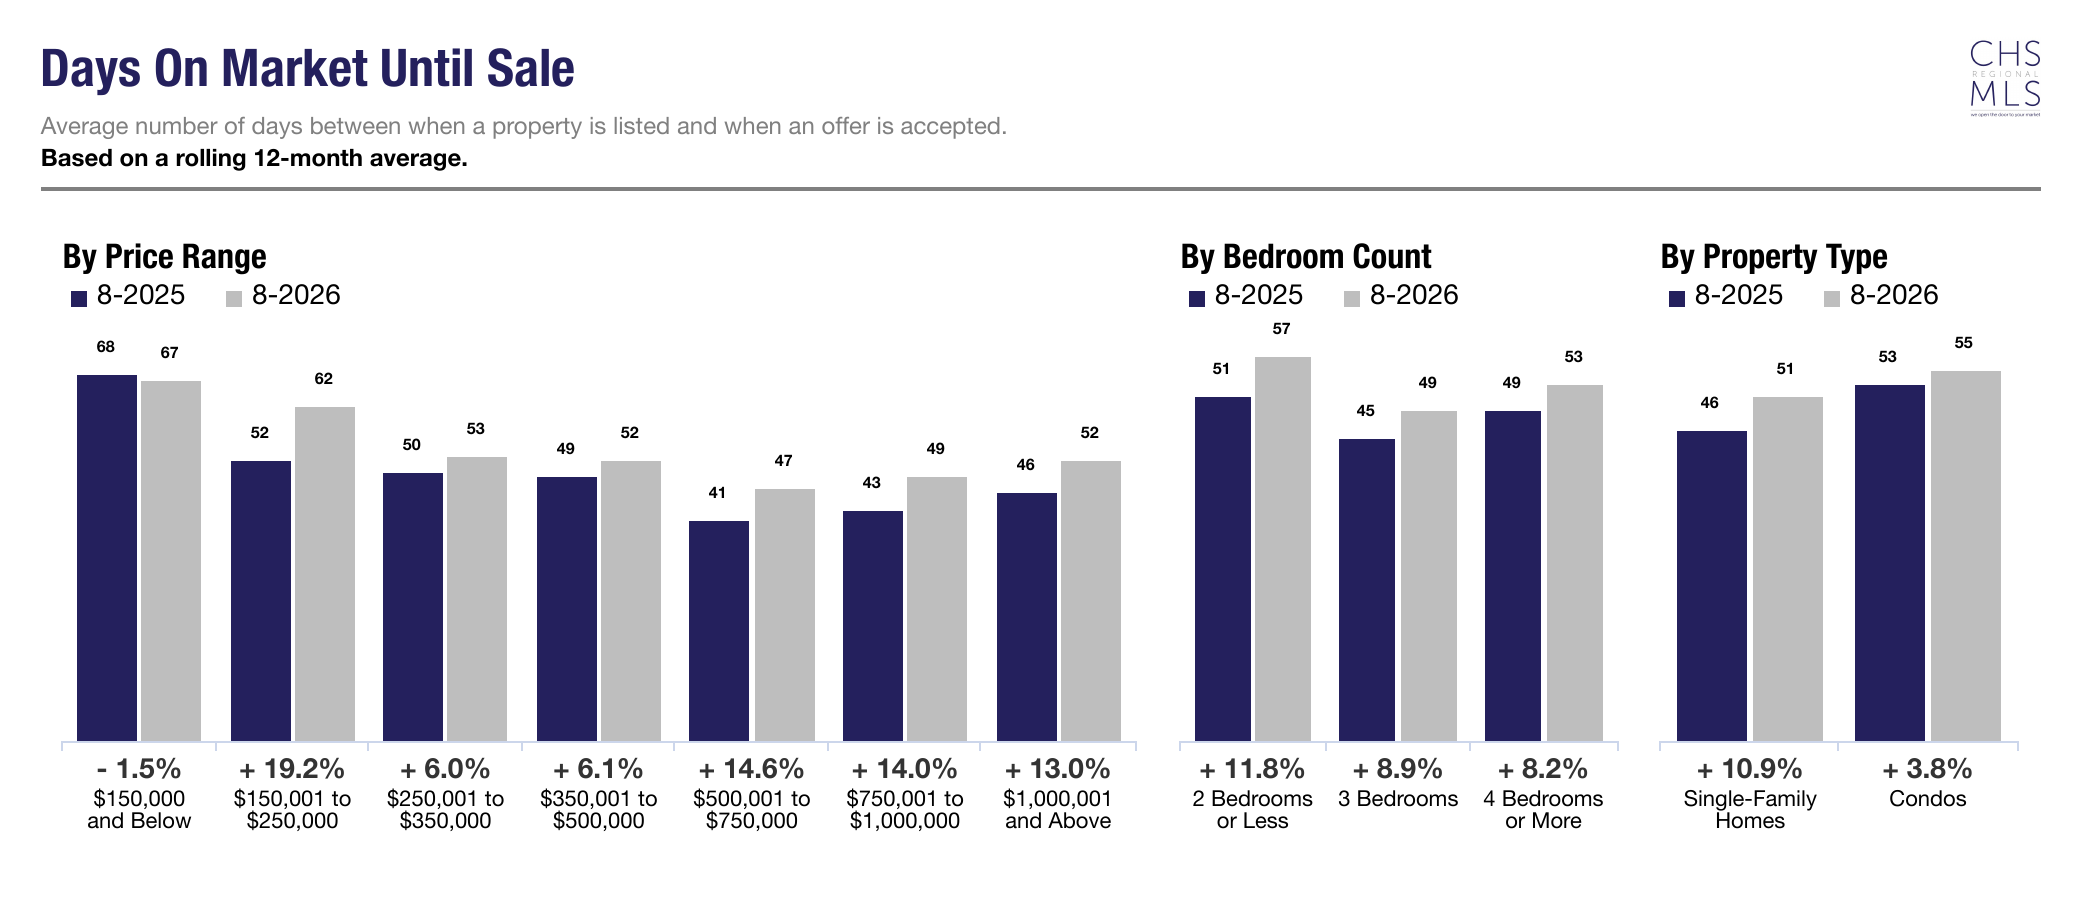
Days on Market Unit Sale - August 2026, CHSMLS
The Upper End Continues to Stand Out
Charleston's higher-priced residential market remains an important source of activity.
Across the region, pending sales above $1 million increased 14.5% over the rolling 12-month period, while closed transactions rose 10.6%.
This continued activity is particularly relevant in Charleston's established luxury communities, where limited land availability, distinctive architecture, waterfront access, and neighborhood character contribute to highly localized market conditions.
However, even within the luxury segment, performance is far from uniform.
Some communities are experiencing stronger transaction activity and higher sale prices, while others are seeing increased inventory and longer marketing periods.
The result is a market where the characteristics of an individual property and its competitive positioning remain especially important.
Charleston's Communities Are Telling Different Stories
Regional statistics provide a useful overview, but August's local market reports reveal considerable differences across Charleston's communities.
Downtown Charleston
Downtown Charleston continues to demonstrate substantial activity in its single-family residential market.
August's average sales price for detached homes reached approximately $3.03 million, an increase of 7.3% compared to August 2025.
Year-to-date detached closed sales increased 31.8%, while the year-to-date average sales price rose 21.7% to approximately $3.11 million.
At the same time, detached inventory increased 30.2% year over year, indicating that buyers have more properties to consider despite continued activity at the upper end.
The condominium market followed a different pattern, with August closed sales declining 48.0% year over year, underscoring the importance of distinguishing between property types.
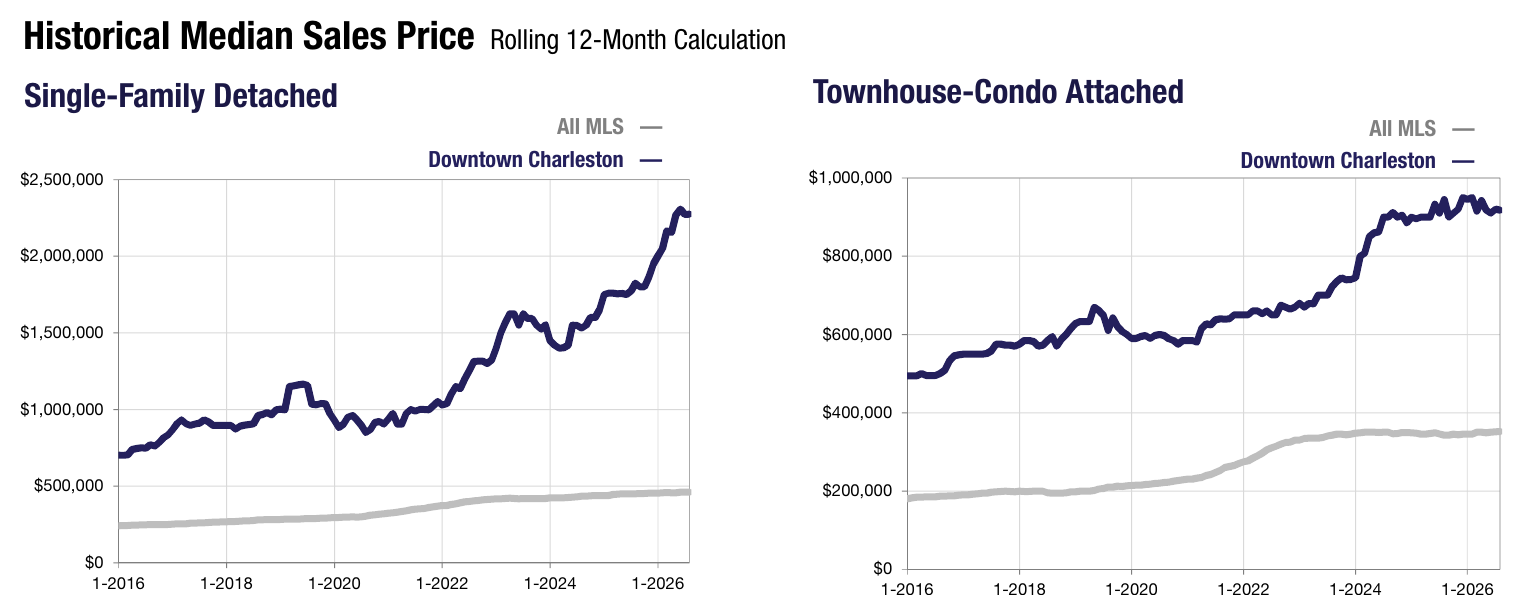
DOWNTOWN CHARLESTON HISTORIC MEDIAN SALES PRICE - 10 YEAR LOOKBACK, CHSMLS
Daniel Island
Daniel Island experienced notable sales activity in August.
Detached closed sales increased 45.5% year over year, while year-to-date detached sales rose 13.6%.
The year-to-date average sales price for detached homes reached approximately $2.62 million, an increase of 12.4% compared to the same period in 2025.
Attached properties also demonstrated significant activity, with year-to-date closed sales more than doubling compared to the previous year.
While transaction volumes in individual property categories can produce substantial percentage changes, the broader figures indicate continued demand across multiple segments of the Daniel Island market.
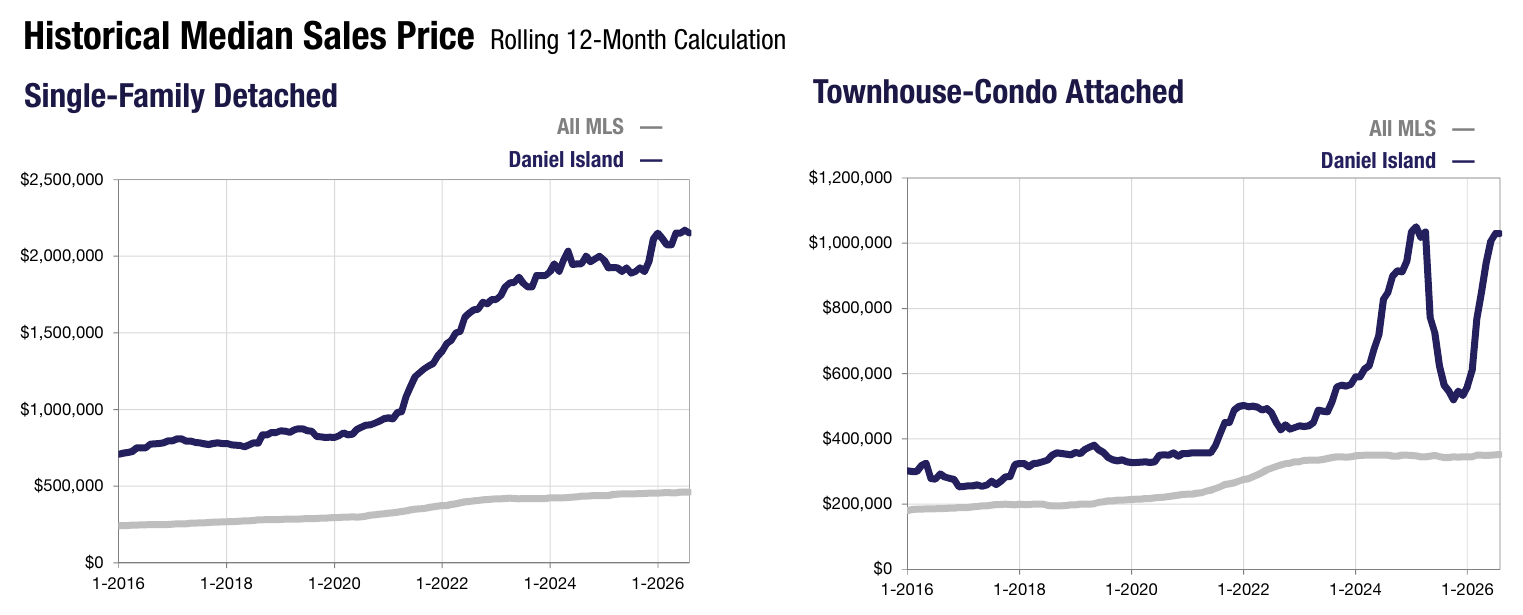
DANIEL ISLAND HISTORIC MEDIAN SALES PRICE - 10 YEAR LOOKBACK, CHSMLS
Mount Pleasant
Mount Pleasant's housing market continues to demonstrate why geographic distinctions matter.
In Lower Mount Pleasant, detached closed sales increased 18.2% year over year during August, while the median sales price remained relatively stable at approximately $1.19 million.
Detached inventory declined 12.8%, suggesting a more limited selection of available single-family homes.
Upper Mount Pleasant presented a different picture. Detached closed sales declined 6.4% year over year, while the median sales price decreased 5.6% to $935,000. Average days on market increased from 34 to 53 days.
These differences illustrate how market conditions can vary considerably even within the same municipality.
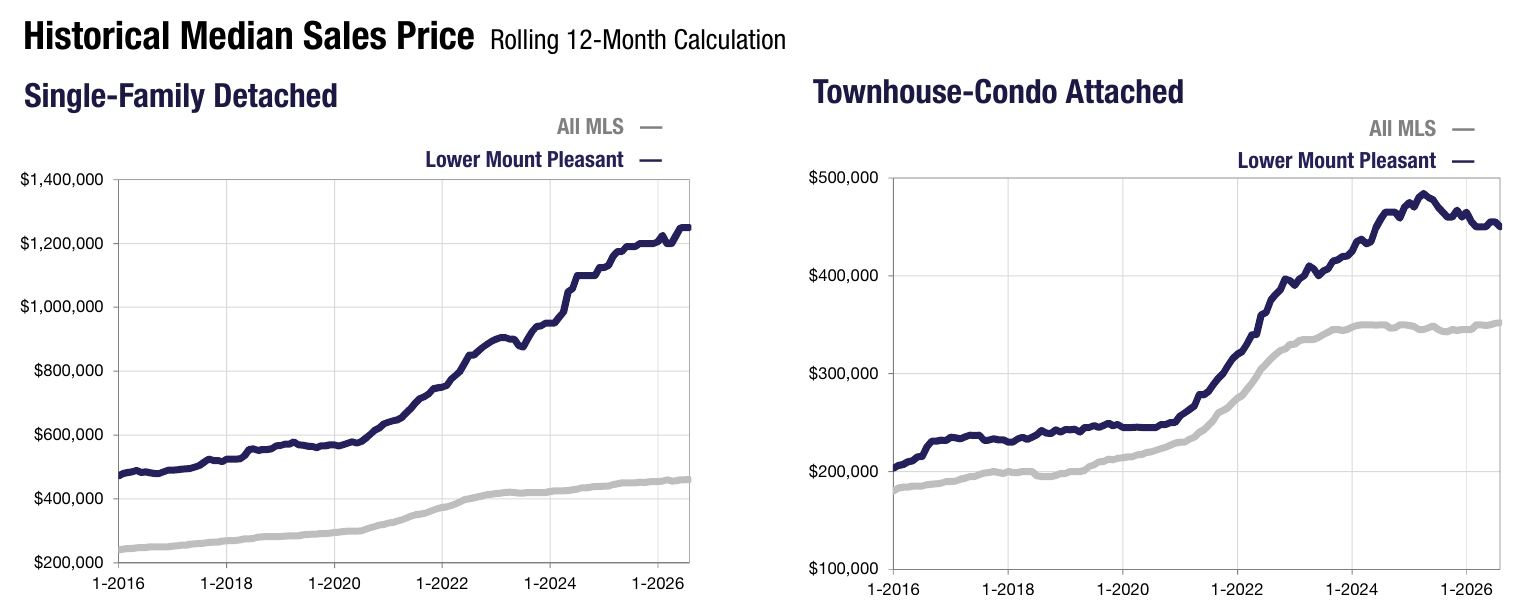
LOWER MOUNT PLEASANT HISTORIC MEDIAN SALES PRICE - 10 YEAR LOOKBACK, CHSMLS
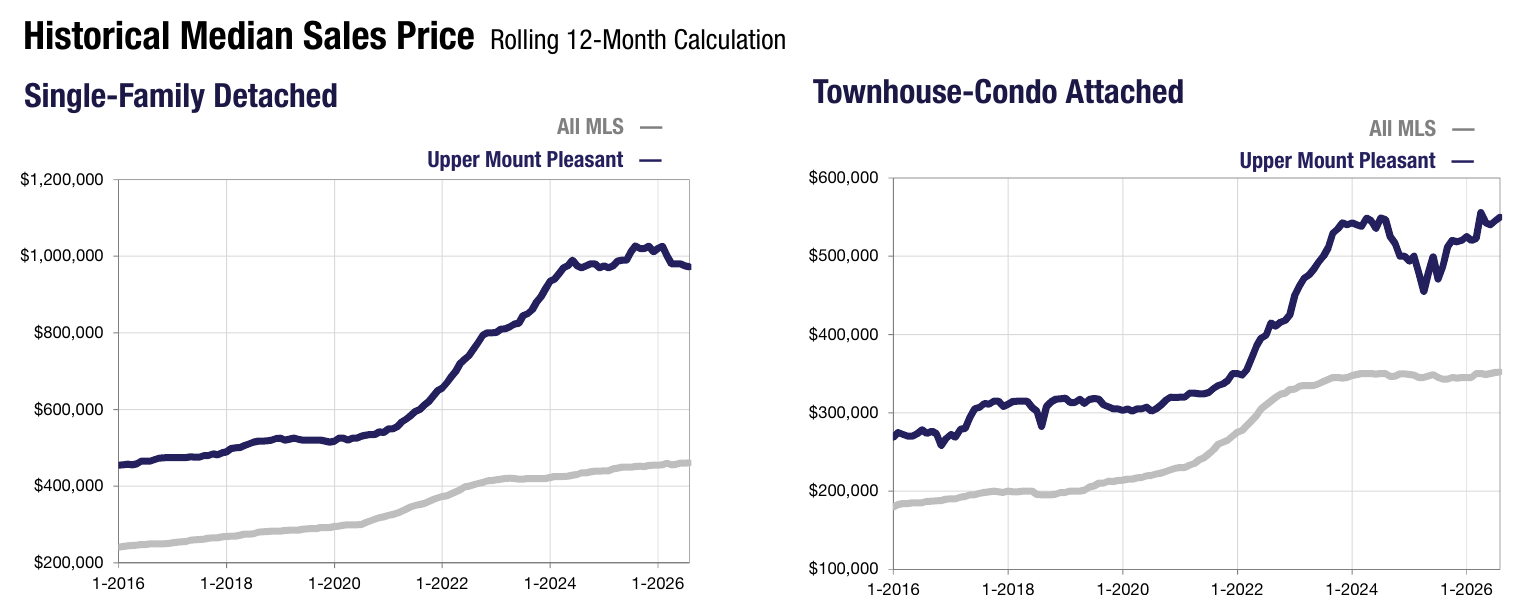
UPPER MOUNT PLEASANT HISTORIC MEDIAN SALES PRICE - 10 YEAR LOOKBACK, CHSMLS
Isle of Palms
Isle of Palms experienced a more selective August market.
Detached inventory increased 26.0% year over year, while detached closed sales declined from 21 transactions in August 2025 to seven in August 2026.
Average days on market for detached properties increased from 72 to 115 days.
Despite the slower transaction pace, the average detached sales price increased 3.0% year over year to approximately $3.53 million.
Given the relatively small number of transactions, monthly changes in Isle of Palms should be interpreted carefully. Individual high-value sales can meaningfully influence reported averages.
The broader picture suggests that the island's luxury market continues to command substantial property values, even as buyers take more time and transaction activity varies.
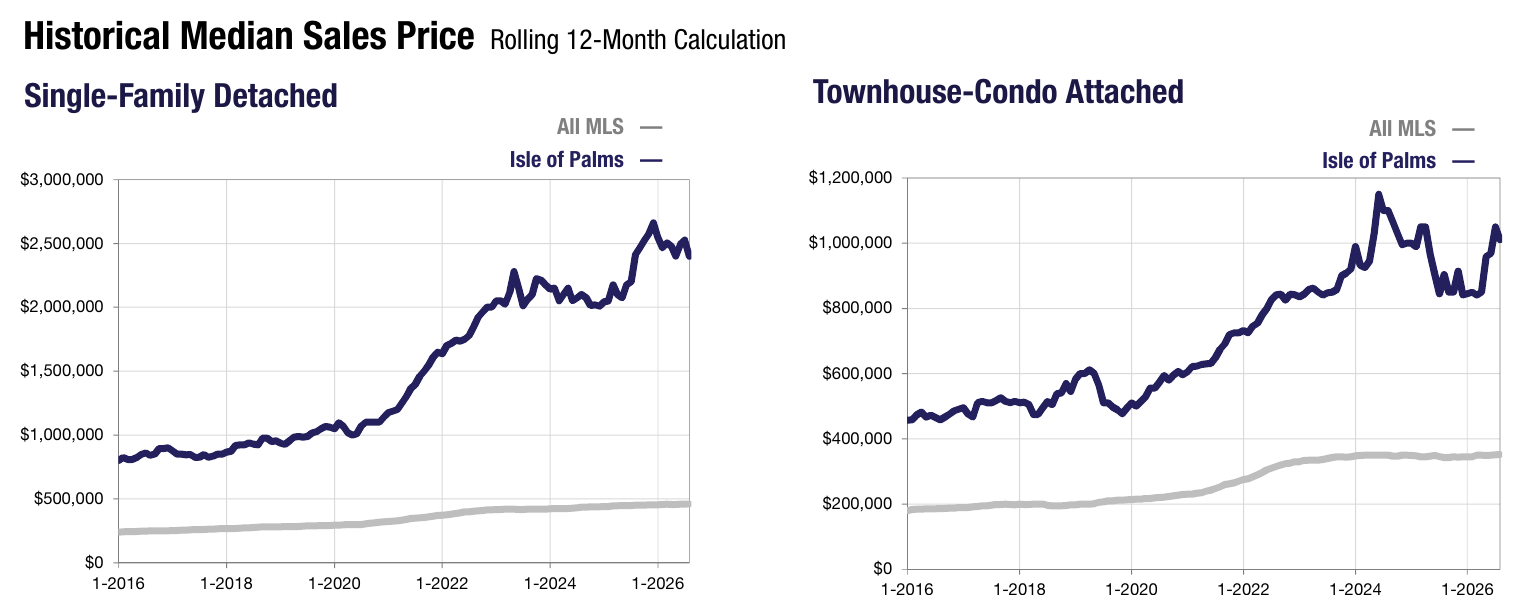
ISLE OF PALMS HISTORIC MEDIAN SALES PRICE - 10 YEAR LOOKBACK, CHSMLS
Johns Island
Johns Island demonstrated relatively stable detached sales activity during August, with 54 closed transactions, unchanged from the previous year.
Detached inventory declined 15.2% year over year, while the average sales price decreased 2.3% to approximately $855,823.
The longer-term picture was more positive, with year-to-date detached closed sales increasing 9.4% and the average sales price rising 10.5%.
Attached properties experienced stronger August transaction growth, with closed sales increasing from seven to 16 compared to the same month last year.
The contrast between monthly pricing and year-to-date performance illustrates why longer-term trends remain essential when evaluating local market conditions.
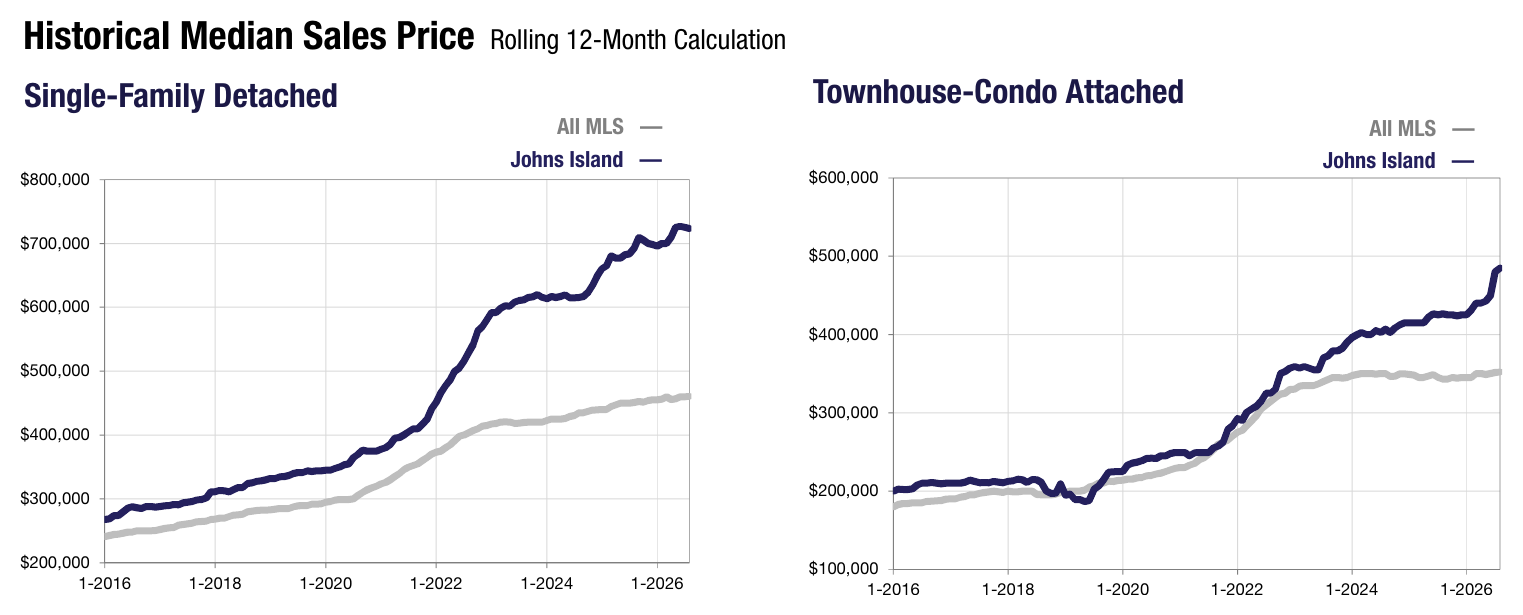
JOHNS ISLAND HISTORIC MEDIAN SALES PRICE - 10 YEAR LOOKBACK, CHSMLS
Summerville and Surrounding Communities
The Greater Summerville area continued to demonstrate meaningful transaction activity, particularly among detached homes.
August detached closed sales increased 4.9% year over year, while the average sales price rose 7.0% to approximately $443,635.
Year-to-date detached sales increased 13.2%, indicating sustained activity despite longer marketing periods.
In Goose Creek and Moncks Corner, detached closed sales declined 10.4% year over year during August, although the average sales price increased 3.1%.
Hanahan experienced stronger monthly detached sales activity, with closed transactions increasing from 15 to 24 year over year. However, year-to-date detached sales remained 21.8% below the prior year's pace.
These communities reinforce the importance of evaluating both recent activity and broader trends when interpreting market performance.
Greater Summerville Area
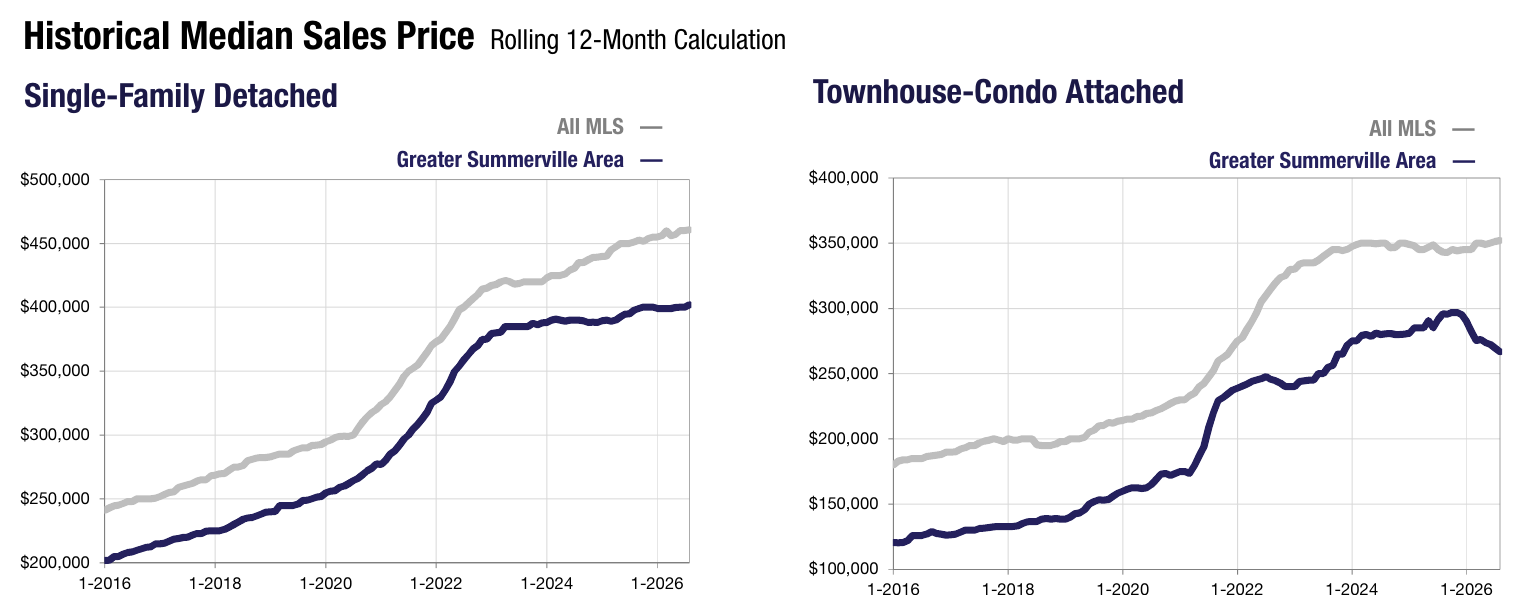
GREATER SUMMERVILLE HISTORIC MEDIAN SALES PRICE - 10 YEAR LOOKBACK, CHSMLS
Goose Creek / Monck's Corner
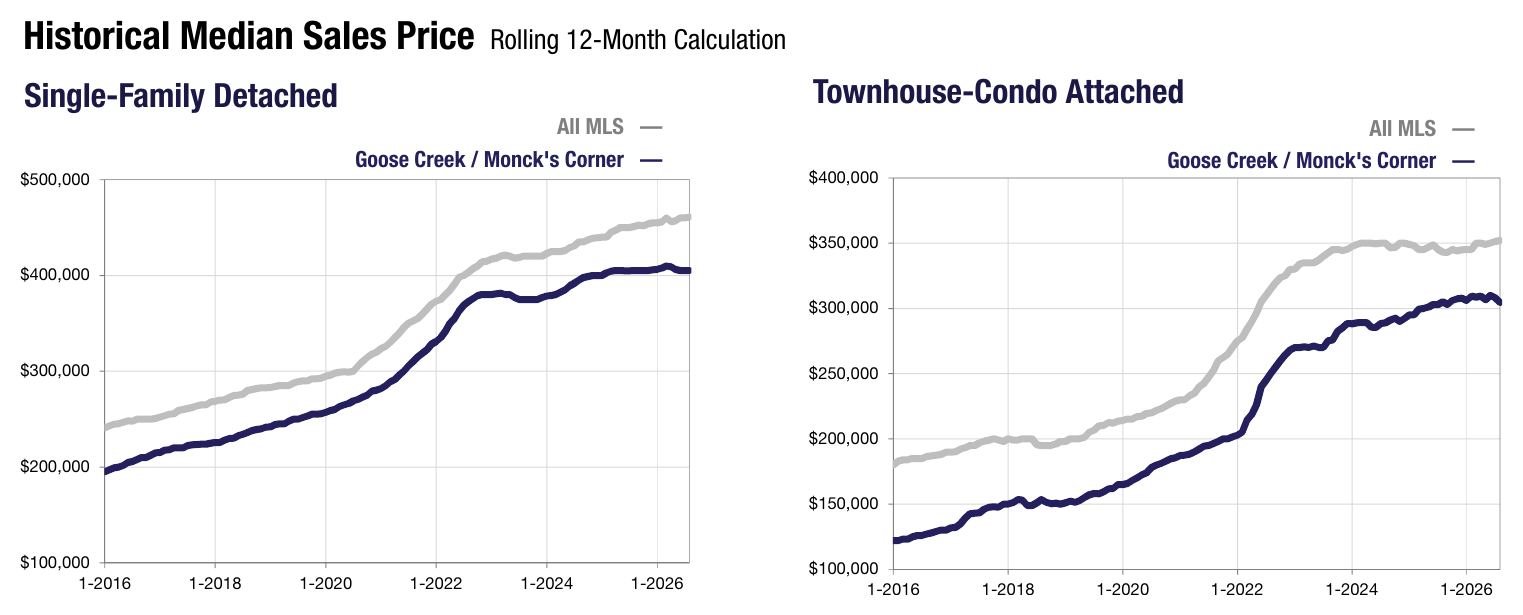
GOOSE CREEK / MONCK'S CORNER HISTORIC MEDIAN SALES PRICE - 10 YEAR LOOKBACK, CHSMLS
Hanahan
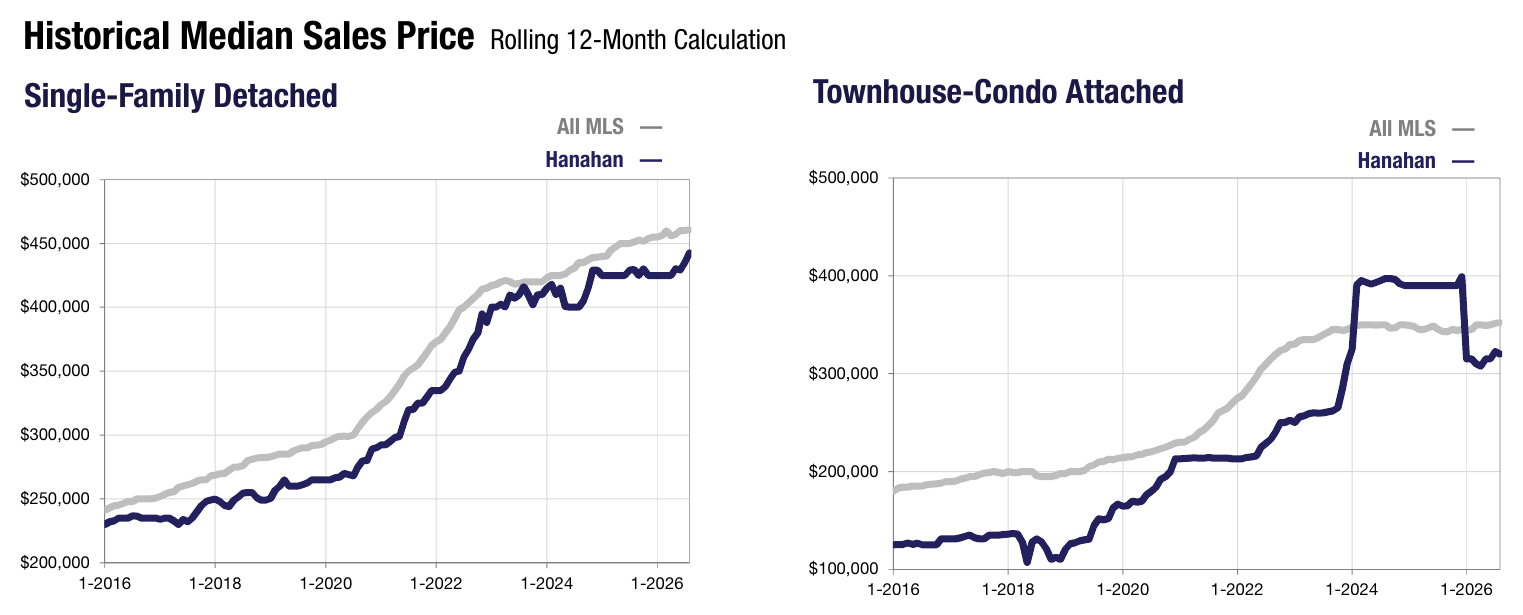
HANAHAN HISTORIC MEDIAN SALES PRICE - 10 YEAR LOOKBACK, CHSMLS
What This Means for Buyers and Sellers
For buyers, the Charleston market continues to offer opportunities to evaluate a broader selection of properties, particularly in segments where inventory has increased and marketing periods have lengthened.
However, greater choice does not necessarily mean reduced competition across every community or price range. Well-positioned properties in desirable locations may continue to attract meaningful interest.
For sellers, the importance of preparation and strategic positioning has become increasingly evident.
With buyers taking more time to evaluate their options, pricing a property appropriately and presenting it effectively can play a significant role in its performance.
Understanding the competitive landscape surrounding an individual property remains essential, particularly in a market where neighboring communities and different property types may be experiencing very different conditions.
Looking Ahead
As Charleston moves into the final months of 2026, several trends will be important to watch.
Inventory growth has moderated, while longer-term pending and closed sales continue to demonstrate resilience. Price appreciation remains relatively measured across the broader market, even as individual communities experience more pronounced fluctuations.
The continued strength of higher-priced transactions also suggests that Charleston's luxury residential market remains an important component of regional activity.
Ultimately, August's data reinforces a central theme: Charleston is not moving in a single direction.
Instead, the market is becoming increasingly dependent on location, property type, pricing, and the specific conditions surrounding each transaction.
For buyers and sellers alike, informed decisions will require more than an understanding of regional averages. They will require local expertise, thoughtful preparation, and a strategy aligned with the realities of today's market.
At IndigoOak Christie’s International Real Estate, our approach combines local market knowledge with personalized representation, helping clients navigate Charleston's evolving real estate landscape with confidence.
Data Sources & Methodology
This report draws on August 2026 market data published by the Charleston Trident Multiple Listing Service through the Charleston Trident Association of REALTORS® and South Carolina REALTORS®.
Regional market trends incorporate monthly inventory figures and rolling 12-month statistics. Local market observations reference August and year-to-date comparisons for detached and attached residential properties.
Market conditions vary by property type, price range, and geographic area. Statistics are subject to revision and should be interpreted within their respective reporting periods.
Check out this article next