
Charleston’s September market combined stronger sales activity than a year earlier with a more deliberate selling pace. Pending and closed sales increased year over year, available inventory was nearly unchanged, and homes took longer to secure an offer. Pricing also gave more than one signal: the median changed only modestly, while the average rose more noticeably.
The monthly comparison adds balance. Both contracts and closings declined from August, inventory edged lower, and average marketing time increased. Those movements sit within a year-to-date market that remains ahead of 2025 in both pending and completed transactions. The result is an active market whose character varies considerably by community and property type.
Annual Demand Is Stronger, Even as the Monthly Pace Moderates
Charleston Trident MLS recorded 1,400 pending sales in September, up 7.9% from a year earlier, and 1,538 closings, up 9.5%. Through September, pending sales reached 14,968, up 7.1%, while closed sales reached 14,434, up 5.5%. Those longer comparisons support a firmer demand picture than the latest monthly declines alone would suggest.
Compared with August, pending sales declined 10.4% and closings declined 5.5%. The measures describe different stages of the transaction cycle, and monthly figures are not seasonally adjusted. A slower month does not by itself establish a change in the broader direction.
Rolling activity also remained ahead: pending sales increased 6.8% over the 12 months ending September, and closings increased 4.5%. The most useful reading is therefore continued annual growth alongside a more restrained September pace.
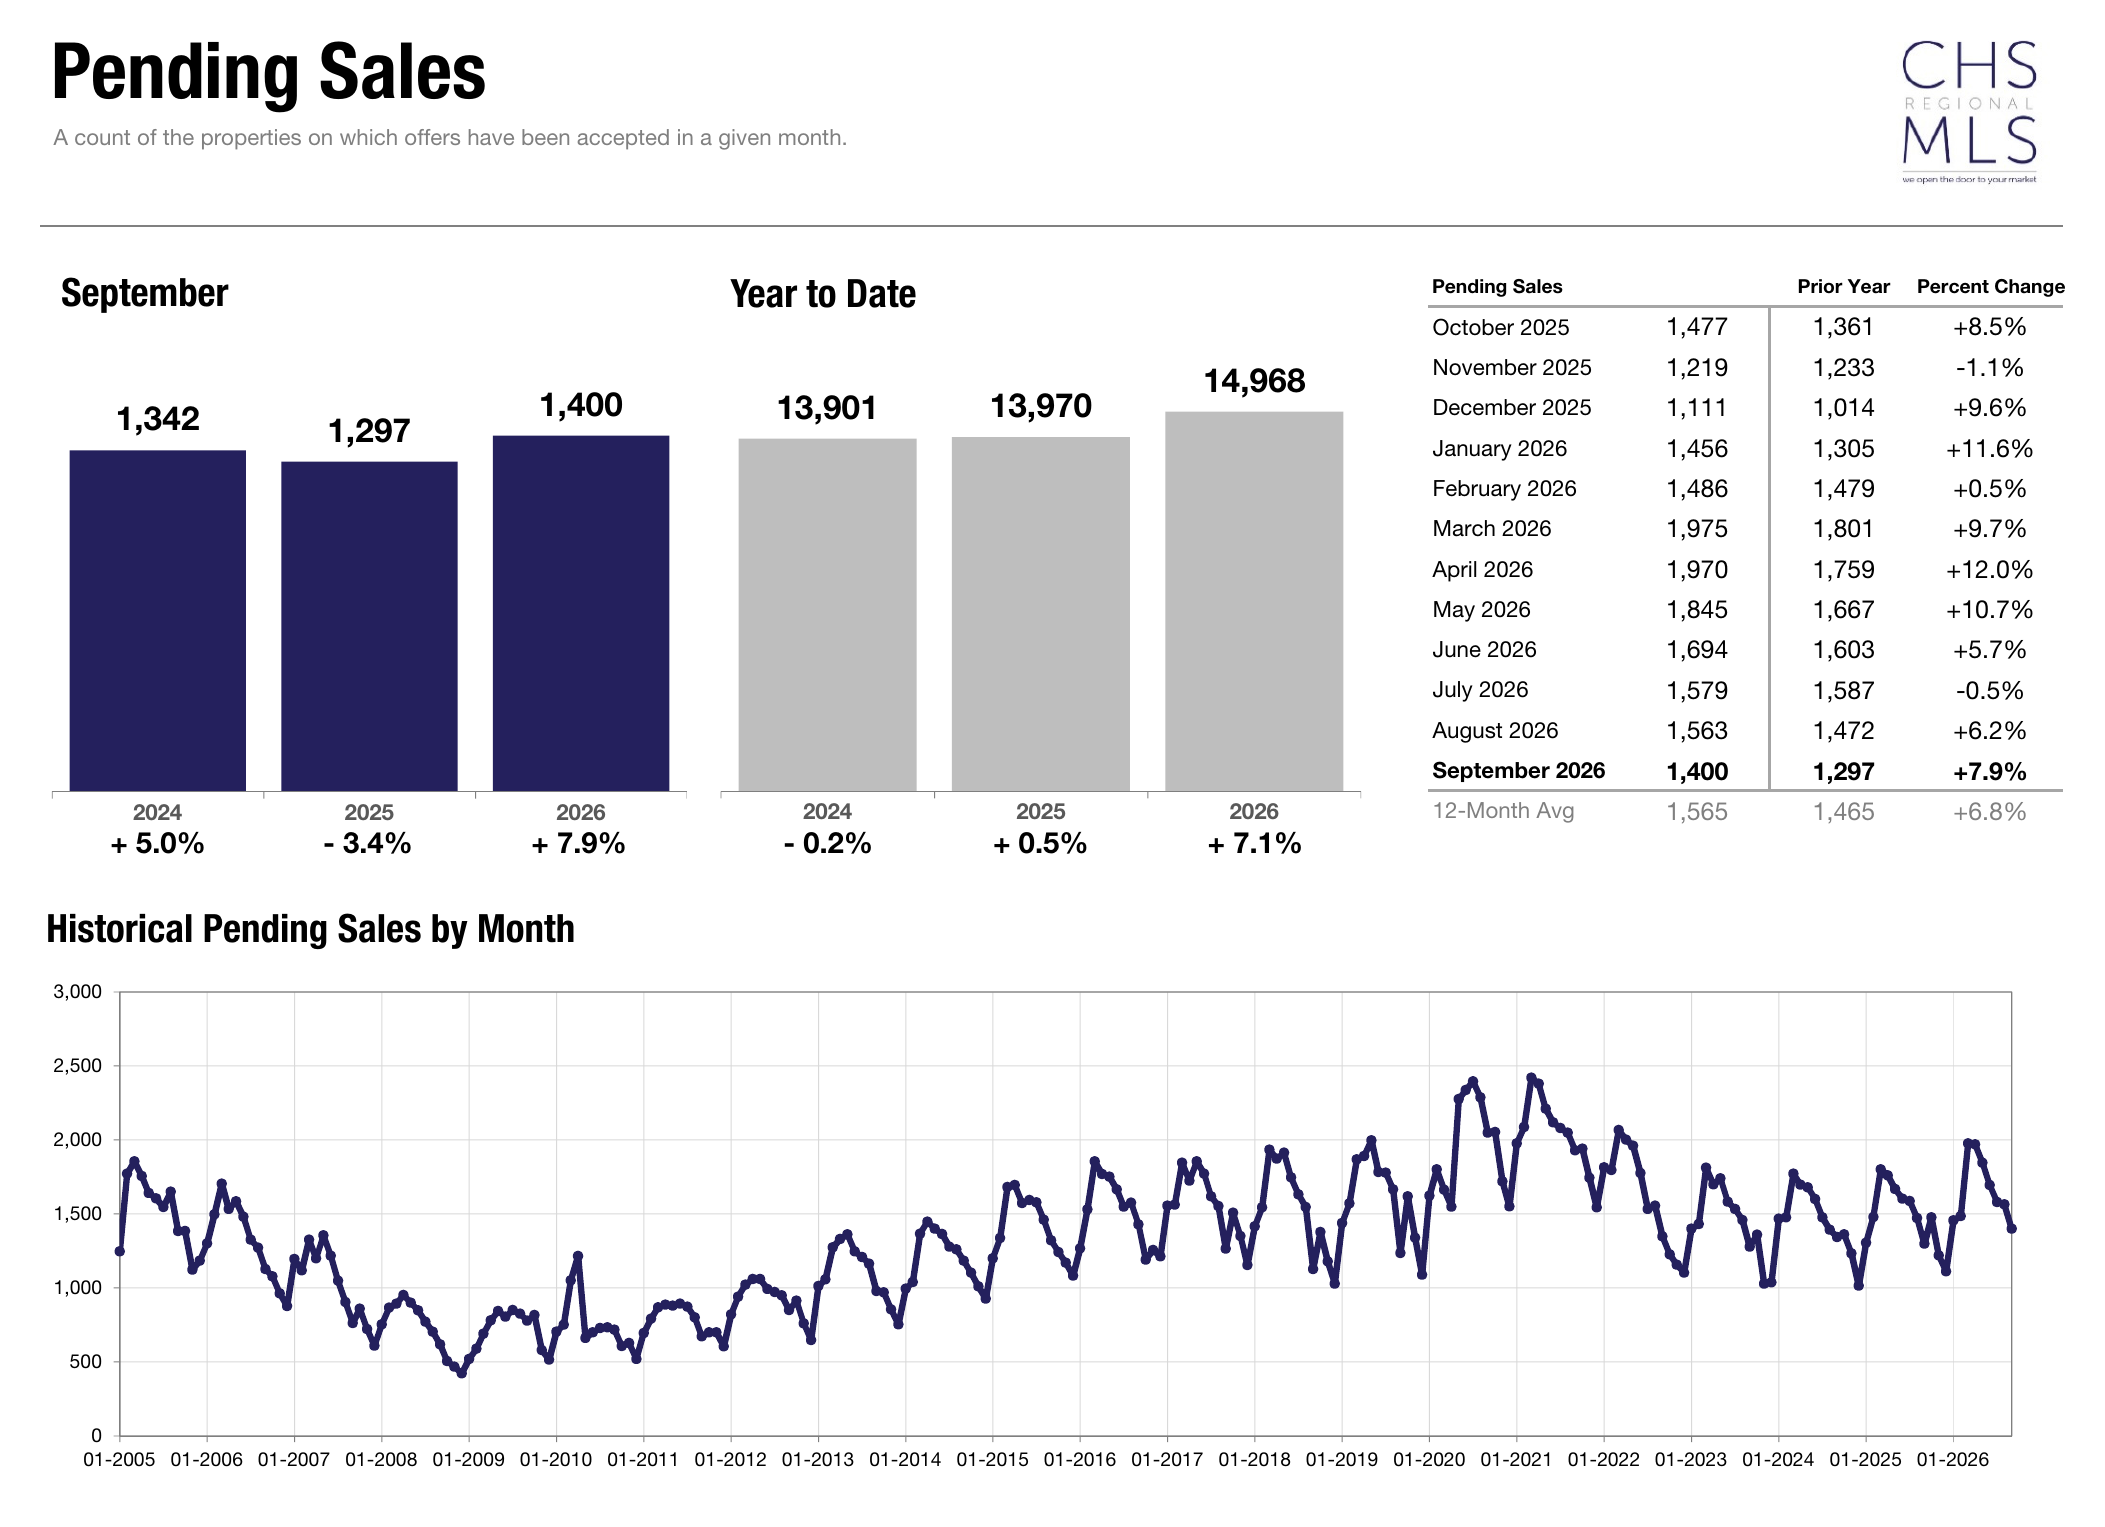
Pending Sales, September 2026, CHSMLS
Inventory Is Steady Annually, with Less Supply Relative to Activity
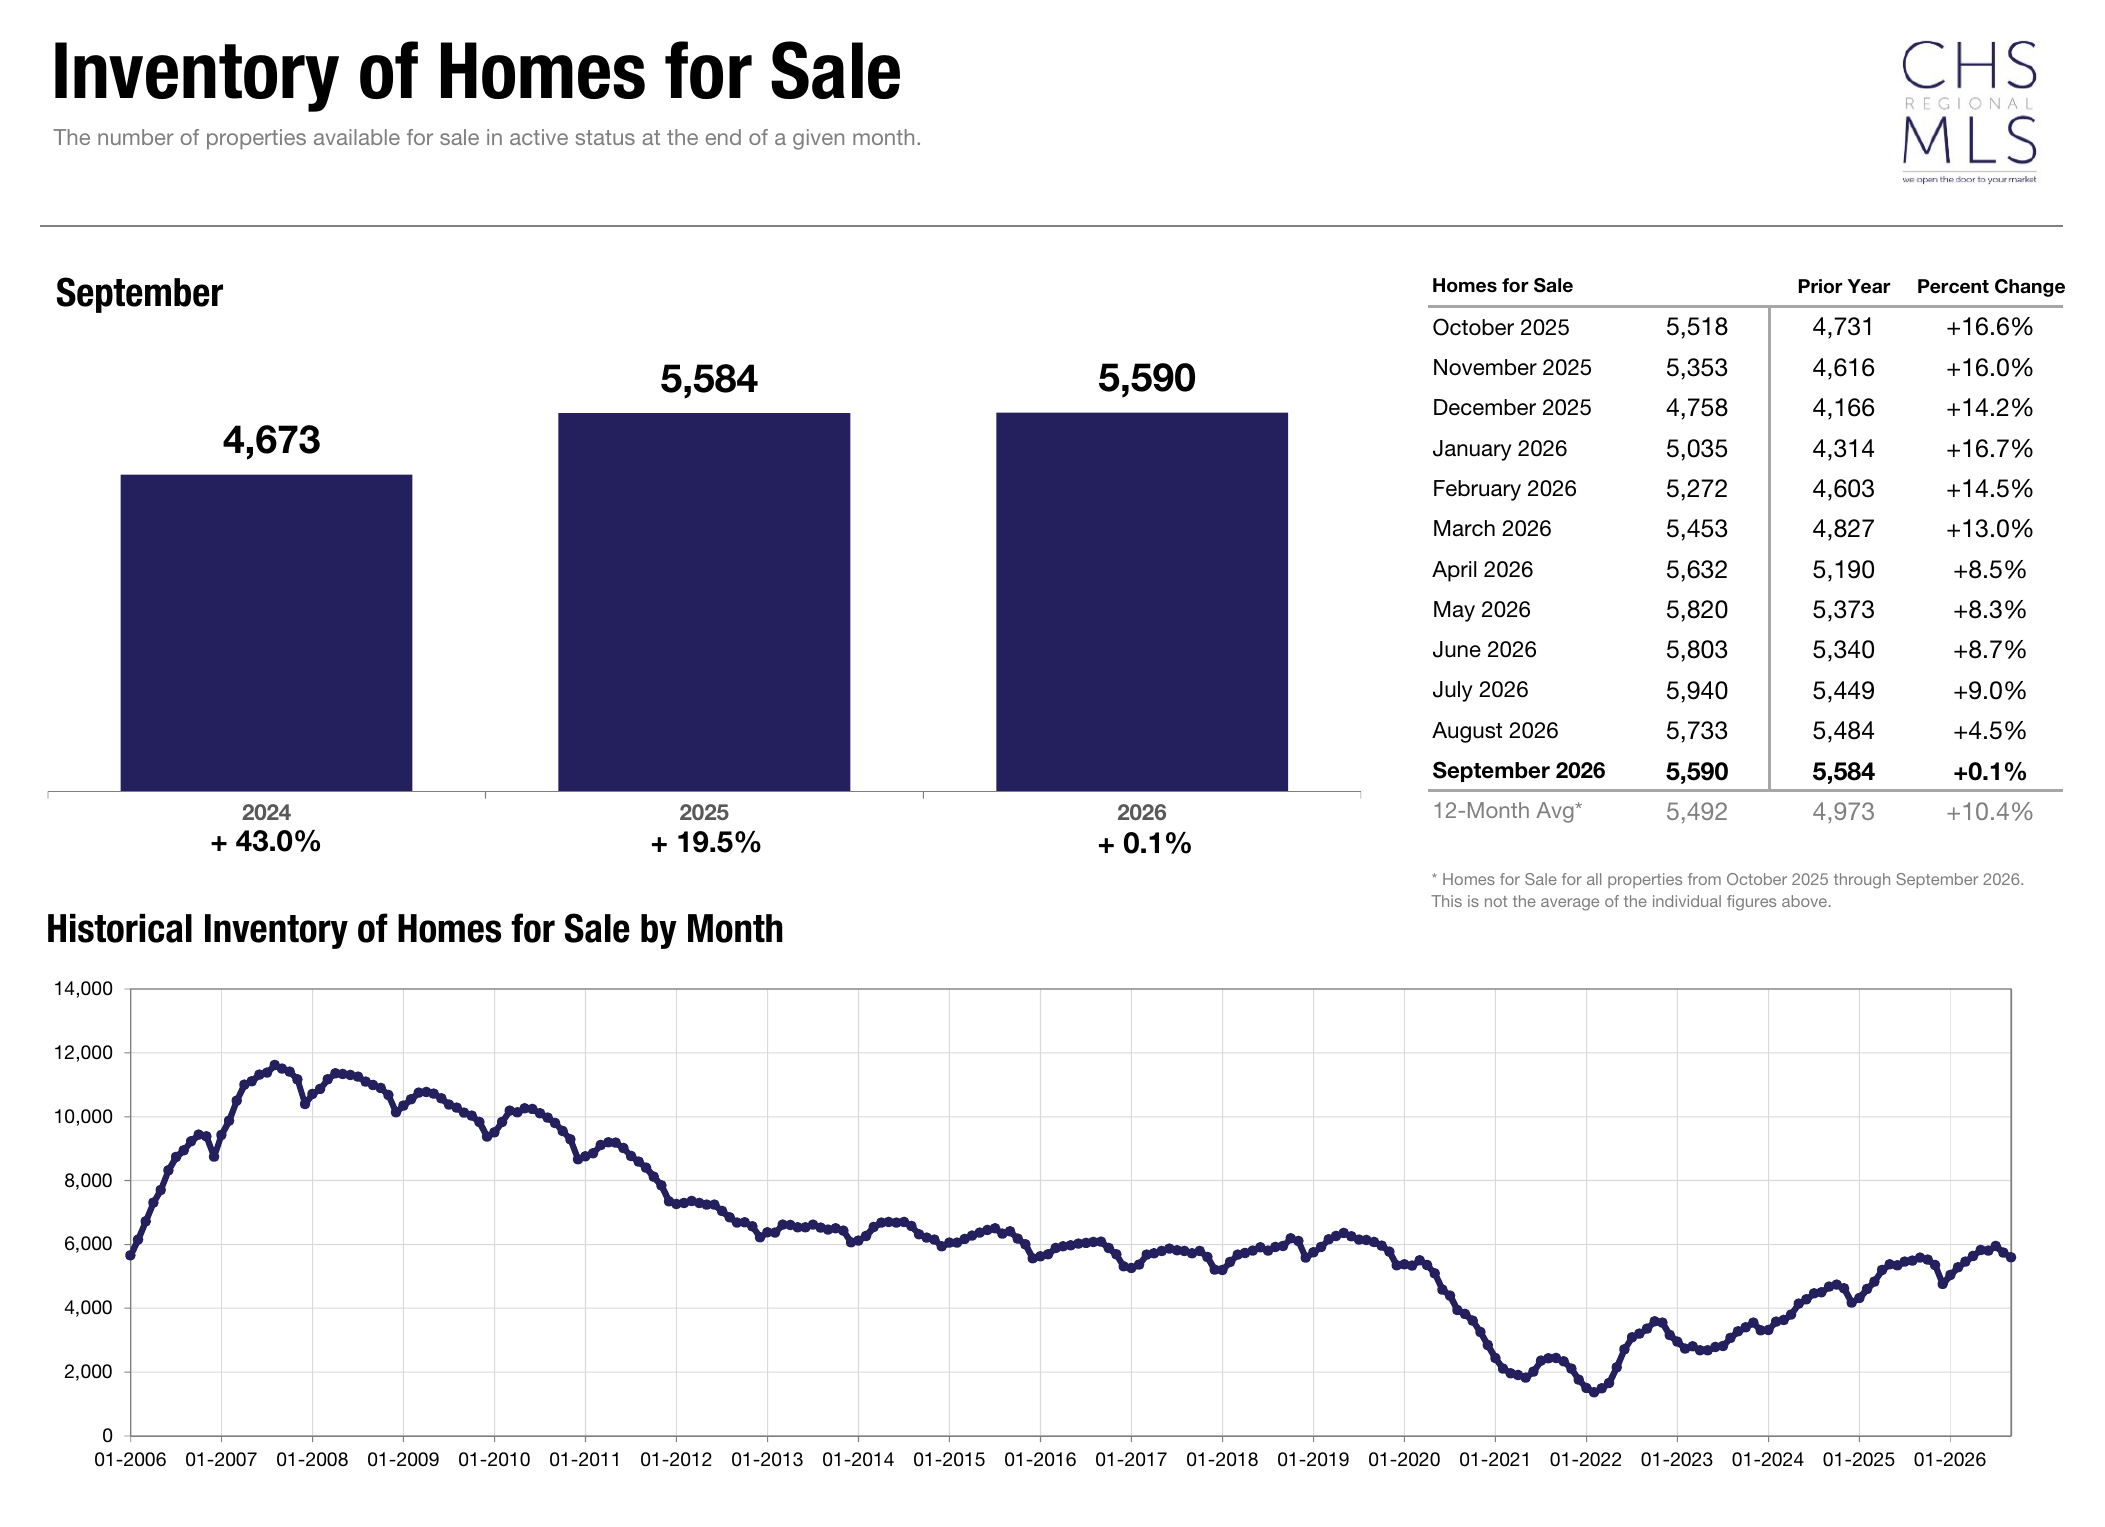
The region ended September with 5,590 homes for sale, almost unchanged from 5,584 a year earlier, an increase of 0.1%. Inventory was 2.5% below August’s 5,733 homes. New listings totaled 2,008, down 0.5% year over year and 3.0% month over month.
Months supply declined to 3.6, compared with 3.8 a year earlier and 3.7 in August. Because the measure relates active inventory to the preceding 12 months of pending activity, inventory can remain stable while months supply declines as the contract pace strengthens.
The balance also differs by price point. The $750,001-$1 million range carried 3.3 months of supply, compared with 3.9 months above $1 million and 4.5 months at $150,001-$250,000. Single-family homes carried 3.5 months, versus 3.7 for condos. Regional availability does not translate into the same conditions for every search or listing.
Months Supply of Inventory, September 2026, CHSMLS
Longer Marketing Times Remain Part of the Market
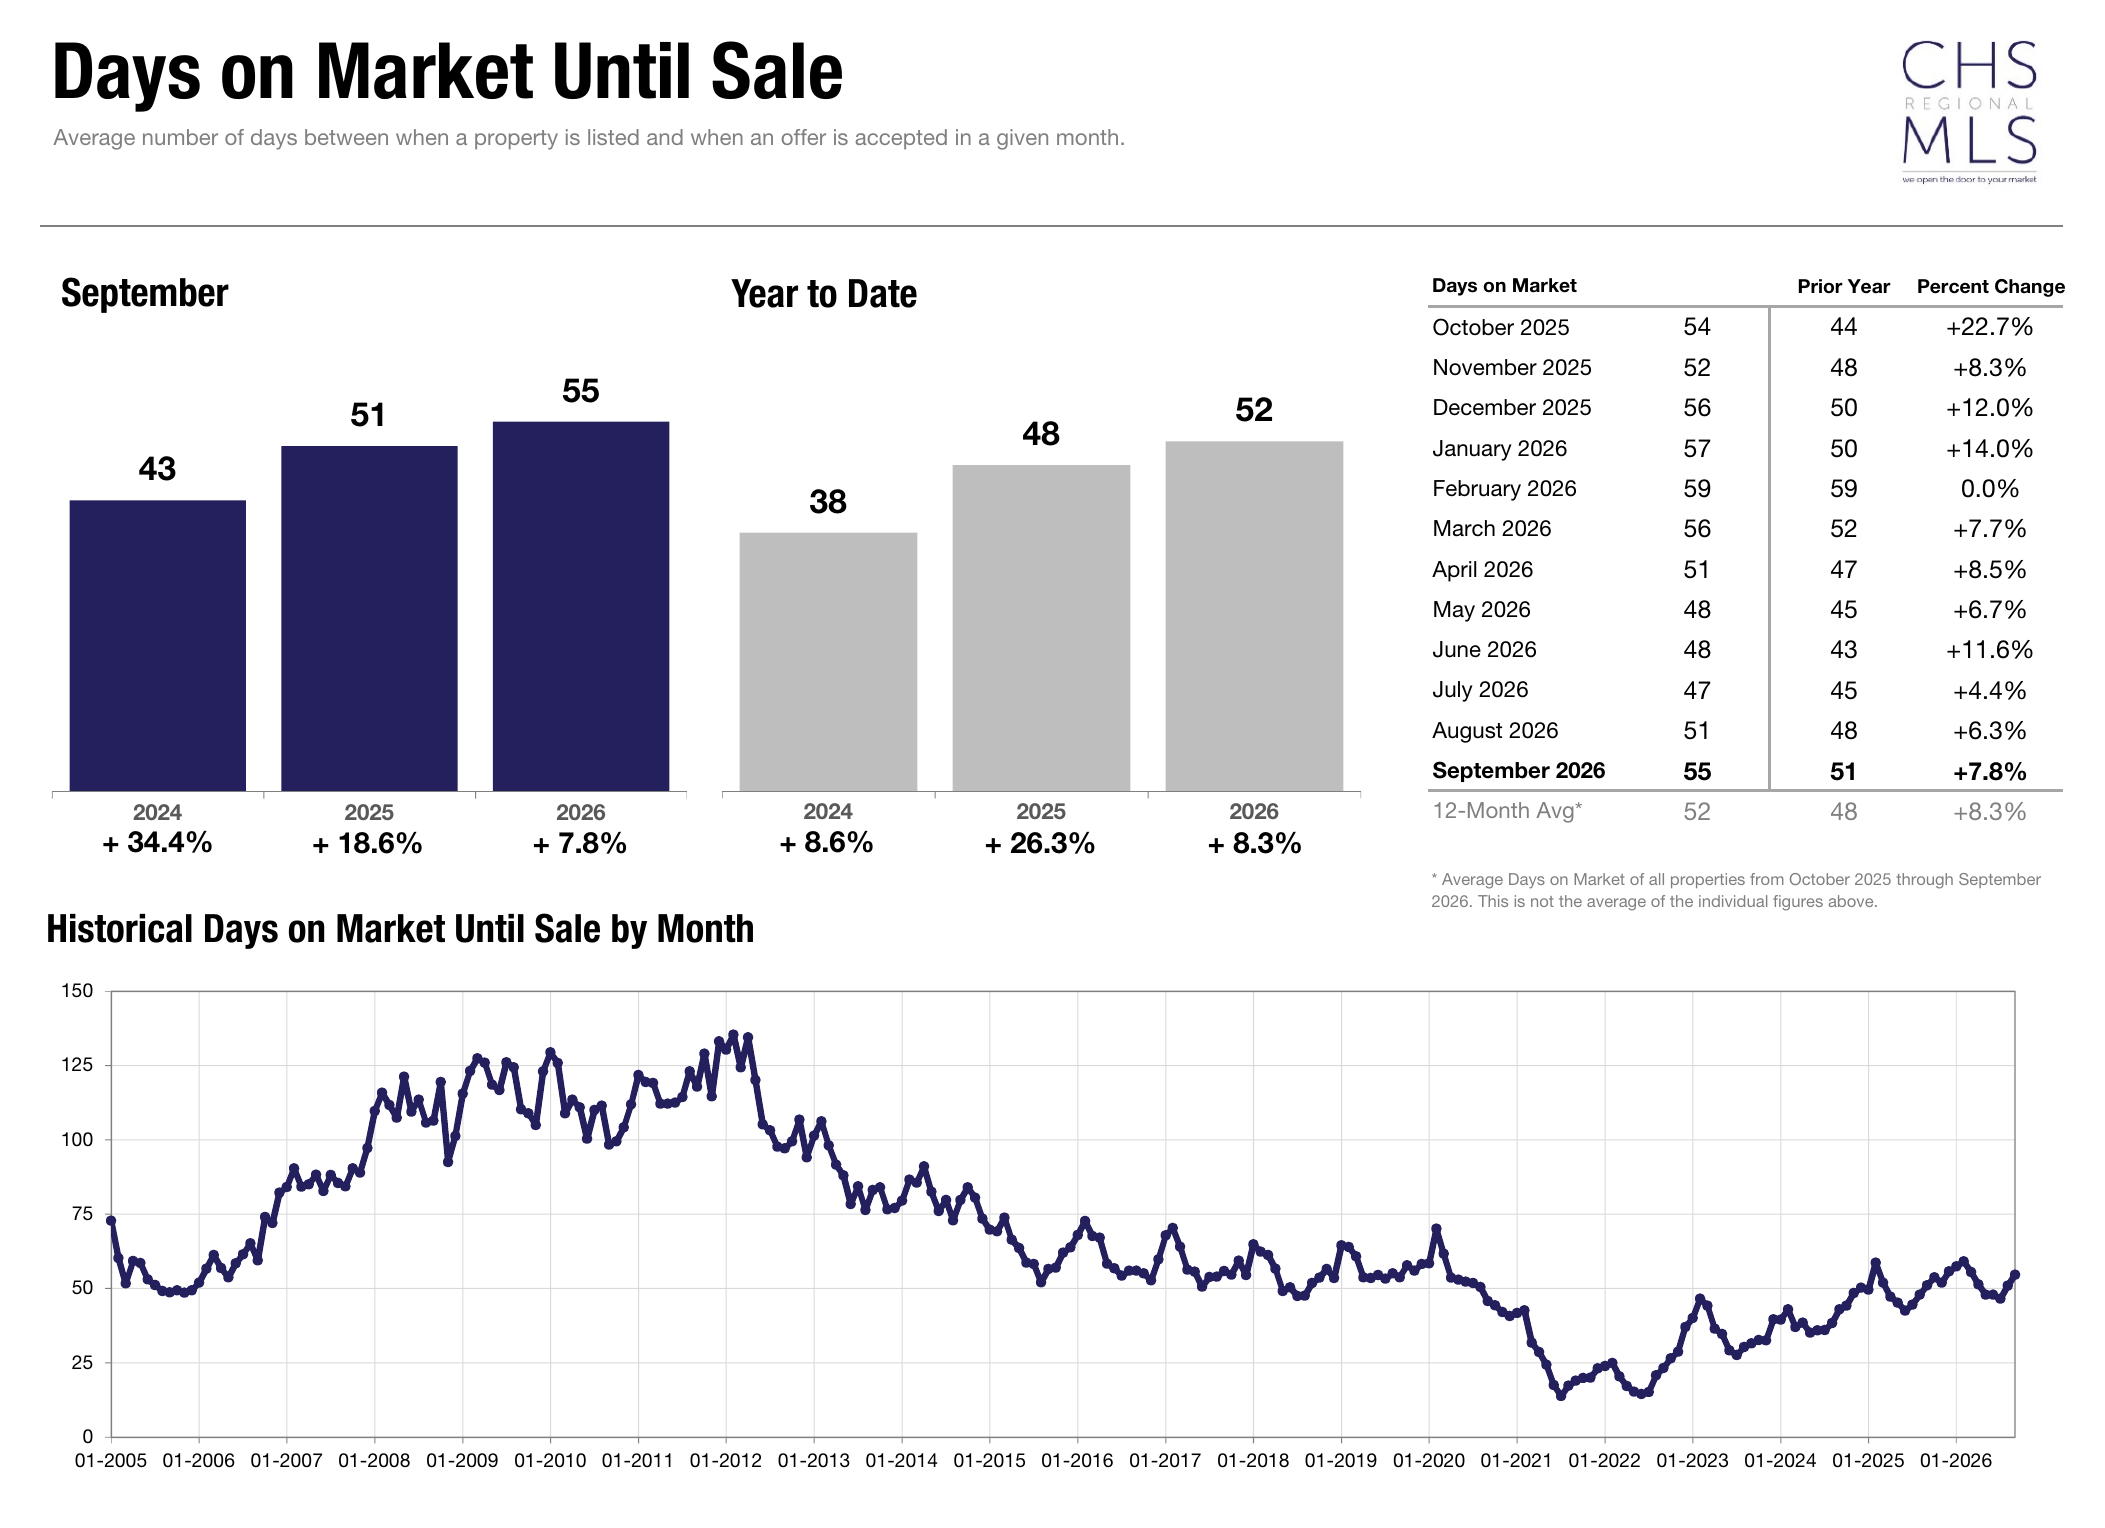
September homes averaged 55 days on market, up 7.8% from 51 days a year earlier and from 51 days in August. Year-to-date marketing time averaged 52 days, up 8.3% from the corresponding 2025 period.
These figures show why stronger sales activity should not be equated with a uniformly faster market. More transactions can occur while buyers take additional time to compare options and reach an agreement. The reports do not establish the specific reasons behind each longer listing period.
Price-range results add context: rolling average marketing time was 48 days at $500,001-$750,000, compared with 70 days at $150,000 and below. Those are rolling measures rather than September-only averages, but they reinforce the need to evaluate the relevant segment.
Days on Market Until Sale, September 2026, CHSMLS
Median and Average Prices Tell Different Parts of the Story
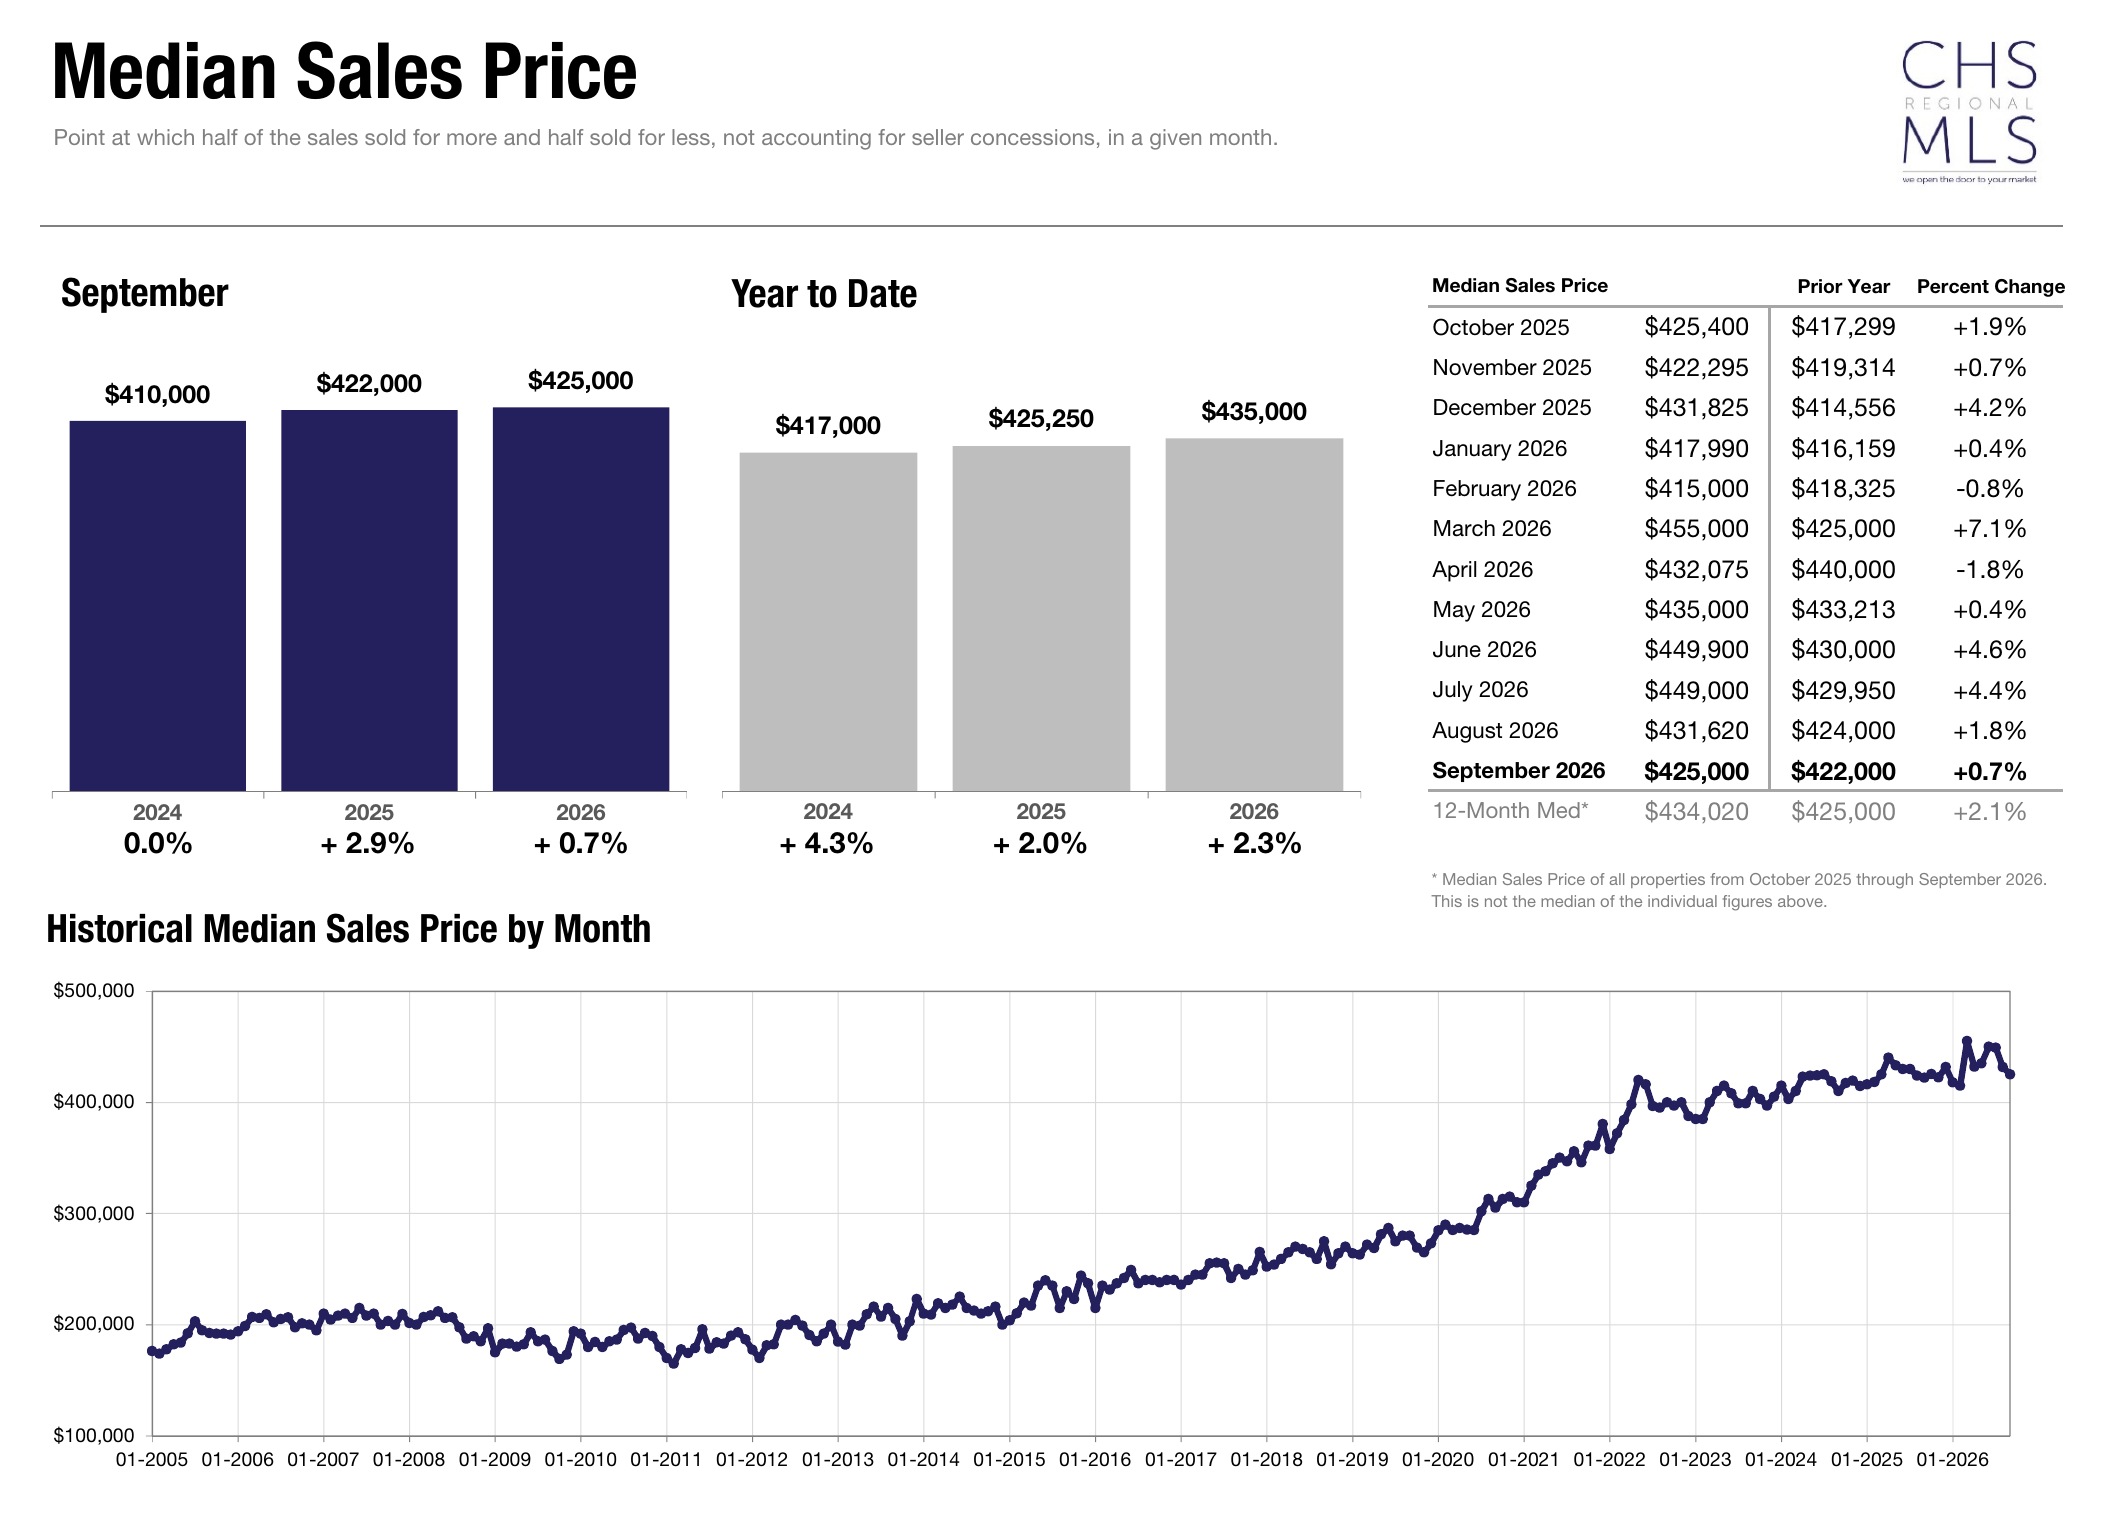
September’s median sale price was $425,000, up 0.7% from a year earlier but down 1.5% from August. The average sale price was $700,519, up 11.0% year over year and 5.4% month over month. Those differences should be explained rather than resolved by selecting only one measure.
The median marks the midpoint of the homes that sold; the average is more sensitive to higher-value transactions. Charleston includes substantially different property types and price points, so changes in the mix of completed sales can influence the average. The aggregate measures do not isolate changes in the value of the same property.
Through September, the median increased 2.3% to $435,000 and the average increased 6.8% to $691,019. The rolling 12-month median increased 2.1% to $434,020. By property type, the rolling single-family median increased 1.7% to $460,000 and the condo median increased 3.3% to $354,000. Those figures suggest more moderate longer-term price movement than September’s average-price gain alone might imply.
Median Sales Price, September 2026, CHSMLS
Higher Price Ranges Continue to Generate Activity
Over the 12 months ending September, pending sales above $1 million increased 15.5%, from 2,288 to 2,642. The $750,001-$1 million bracket increased 14.2%, while the $500,001-$750,000 bracket increased 8.8%. Those gains were stronger than the 6.8% increase across all price ranges.
Rolling closings increased 12.2% above $1 million, 10.1% at $750,001-$1 million and 6.2% at $500,001-$750,000. The $250,001-$350,000 bracket, by comparison, declined 0.7%. The transaction picture is constructive but selective.
Available supply provides a useful counterweight. Inventory above $1 million increased 4.1% to 863 homes, while months supply declined from 4.3 to 3.9. At $750,001-$1 million, inventory declined 8.0% to 403 and supply declined from 4.0 to 3.3 months. These conditions support a closer examination of the upper tiers without implying that every premium property is experiencing the same demand.
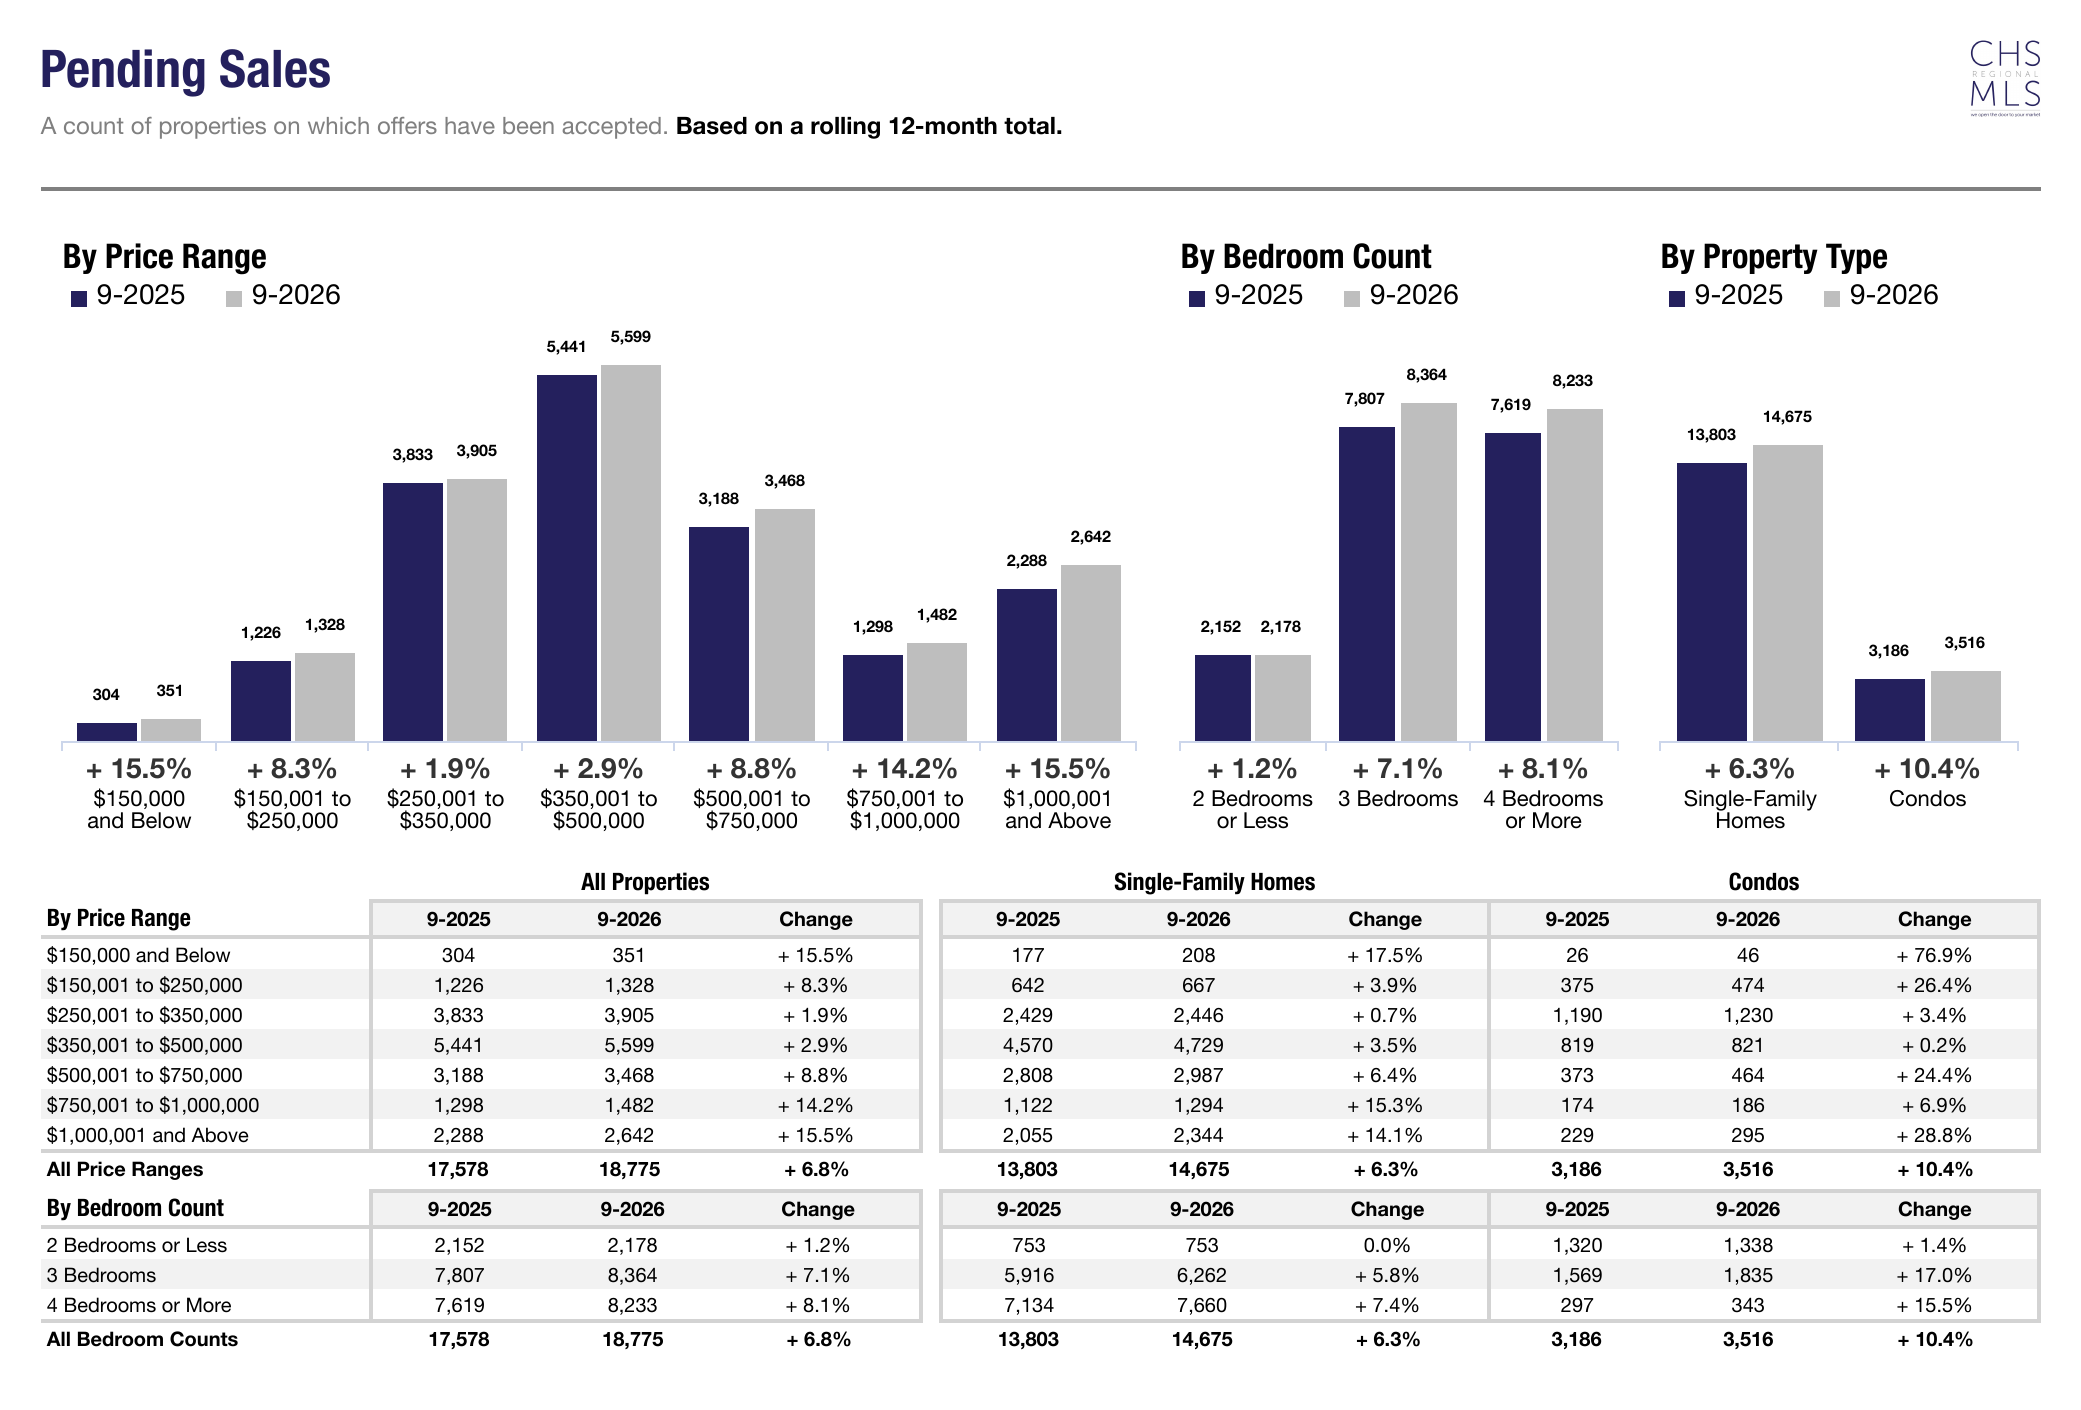
Pending Sales by Price Range, September 2026, CHSMLS
Downtown Charleston, the Islands and Mount Pleasant Differ Considerably
Downtown Charleston recorded 13 detached closings, down 31.6% year over year, and 14 attached closings, down 22.2%. Detached median price increased 36.2% to $2.35 million, while the attached median increased 113.9% to $1,173,750. With only 27 combined transactions, large monthly price movements need context; they do not establish comparable appreciation in individual homes.
Daniel Island recorded stronger activity in both property types: detached closings increased from 11 to 26 and attached closings from 8 to 13. Inventory increased in both segments, to 44 homes in each. The detached median increased 21.5% to $2,672,500, while the attached median increased 11.9% to $1,014,000. More sales and more available inventory can occur at the same time.
Isle of Palms recorded ten detached and five attached closings. Detached average price increased 47.0% to $3,570,150, while attached average price declined 31.8% to $1,022,700. The small transaction counts and different property types make a single island-wide price headline less useful than the underlying detail.
In Lower Mount Pleasant, detached closings increased 29.3% to 53 and attached closings increased 47.1% to 25. Upper Mount Pleasant was more mixed: detached closings increased 6.8% to 63, while attached closings declined 40.0% to 12. Detached inventory declined in both areas, while attached inventory increased. Conditions therefore vary within Mount Pleasant as well as between detached and attached homes.
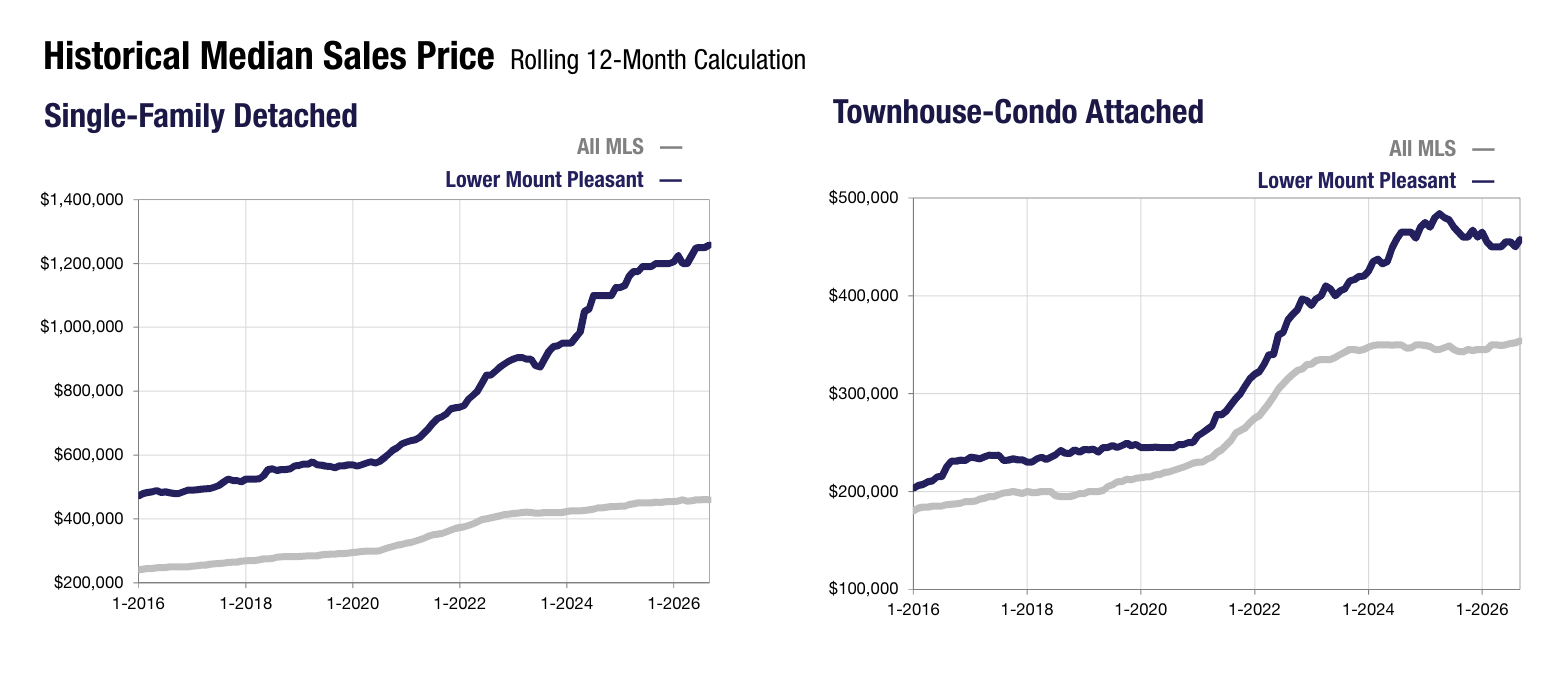
Lower Mount Pleasant Historical Median Sales Price, September 2026, CHSMLS
Johns Island and the Larger Residential Markets Add Another Perspective
Johns Island recorded 46 detached closings, up 15.0%, and 13 attached closings, up 18.2%. Detached median price declined 10.1% to $735,000, while attached median price increased 15.3% to $489,990. The attached inventory count rose from 21 to 36, while detached inventory declined from 187 to 175. The direction of both prices and supply depends on property type.
Greater Summerville recorded 183 detached closings, down 6.6%, and 23 attached closings, up 27.8%. Detached marketing time increased from 37 to 49 days and inventory increased 8.7%, while the detached median declined 1.4% to $396,150. Hanahan’s 12 detached and three attached closings provide a smaller sample; its large percentage changes should be read with those counts in mind.
Goose Creek / Moncks Corner recorded 266 detached closings, up 10.4%, and 57 attached closings, up 58.3%. Detached homes averaged 52 days on market, while attached homes averaged 96. Inventory declined in both categories. The contrast again shows that an expanding transaction count does not necessarily mean a shorter marketing period.
Greater Summerville Historical Median Sales Price, September 2026, CHSMLS
What This Means for Buyers and Sellers
For buyers, Charleston offers an active market with additional time for consideration in many segments, but nearly unchanged annual inventory and lower supply relative to the rolling contract pace. Careful comparison remains useful, particularly where property type and location produce different alternatives.
For sellers, stronger annual activity is encouraging, but it does not remove the need for a clear position against competing listings. Longer marketing times and uneven local results support realistic expectations about timing, price and presentation.
Looking Ahead
The next reports will help show whether Charleston’s positive annual contract pace continues, whether inventory remains steady, and whether the recent monthly slowdown in transactions persists. In the upper tiers, the relationship between stronger rolling demand and available supply will remain important.
The region’s wider numbers are most useful as context. The conditions surrounding a particular home, community and property type remain the practical guide to a considered move.
Data Sources & Methodology
Monthly Indicators, Charleston Trident MLS (CHSMLS), September 2026, current October 9, 2026.
Housing Supply Overview, Charleston Trident MLS (CHSMLS), September 2026, current October 9, 2026.
Local Market Update, Downtown Charleston, September 2026, current October 9, 2026.
Local Market Update, Isle of Palms, September 2026, current October 9, 2026.
Local Market Update, Daniel Island, September 2026, current October 9, 2026.
Local Market Update, Johns Island, September 2026, current October 9, 2026.
Local Market Update, Lower Mount Pleasant, September 2026, current October 9, 2026.
Local Market Update, Upper Mount Pleasant, September 2026, current October 9, 2026.
Local Market Update, Greater Summerville, September 2026, current October 9, 2026.
Local Market Update, Hanahan, September 2026, current October 9, 2026.
Local Market Update, Goose Creek / Moncks Corner, September 2026, current October 9, 2026.
All sources: Charleston Trident MLS / Association of REALTORS; reports by ShowingTime Plus, with South Carolina REALTORS sponsorship where indicated.
YoY means September 2026 versus September 2025 unless stated otherwise. Regional MoM comparisons use August values in the September Monthly Indicators, maintaining a single publication vintage; earlier August reports can differ. YTD covers January-September. Rolling comparisons use October 2025-September 2026 versus October 2024-September 2025. Monthly values are not seasonally adjusted.
Local detached and attached figures are identified separately. Medians are not combined. Community definitions follow the source MLS areas, not assumed municipal boundaries. The separate social reference combines counts and estimates combined averages using closed-sale weights, as disclosed there. Prices exclude concessions and are not same-property appreciation measures. Days on market measures listing to accepted offer; supply relates month-end inventory to trailing average monthly pending sales.
Check out this article next